Chilean vs Immigrants from Moldova 3 or more Vehicles in Household
COMPARE
Chilean
Immigrants from Moldova
3 or more Vehicles in Household
3 or more Vehicles in Household Comparison
Chileans
Immigrants from Moldova
19.7%
3 OR MORE VEHICLES IN HOUSEHOLD
63.0/ 100
METRIC RATING
163rd/ 347
METRIC RANK
19.1%
3 OR MORE VEHICLES IN HOUSEHOLD
23.6/ 100
METRIC RATING
195th/ 347
METRIC RANK
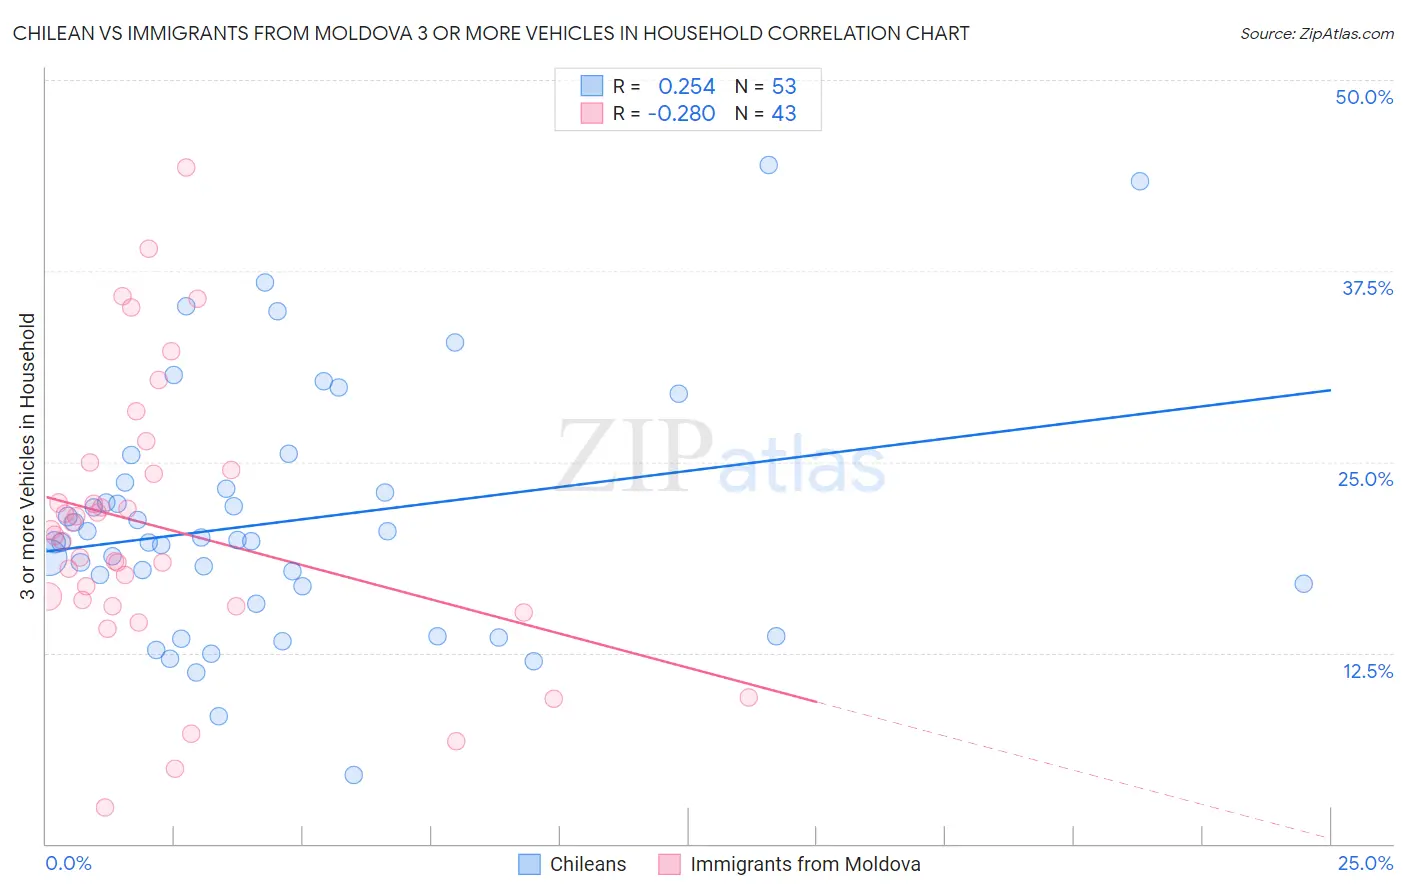
Chilean vs Immigrants from Moldova 3 or more Vehicles in Household Correlation Chart
The statistical analysis conducted on geographies consisting of 256,506,401 people shows a weak positive correlation between the proportion of Chileans and percentage of households with 3 or more vehicles available in the United States with a correlation coefficient (R) of 0.254 and weighted average of 19.7%. Similarly, the statistical analysis conducted on geographies consisting of 124,372,944 people shows a weak negative correlation between the proportion of Immigrants from Moldova and percentage of households with 3 or more vehicles available in the United States with a correlation coefficient (R) of -0.280 and weighted average of 19.1%, a difference of 3.3%.
3 or more Vehicles in Household Correlation Summary
| Measurement | Chilean | Immigrants from Moldova |
| Minimum | 4.5% | 2.4% |
| Maximum | 44.4% | 44.3% |
| Range | 40.0% | 41.9% |
| Mean | 21.1% | 20.7% |
| Median | 19.8% | 20.2% |
| Interquartile 25% (IQ1) | 16.3% | 15.5% |
| Interquartile 75% (IQ3) | 23.4% | 24.5% |
| Interquartile Range (IQR) | 7.2% | 8.9% |
| Standard Deviation (Sample) | 8.2% | 9.0% |
| Standard Deviation (Population) | 8.1% | 8.9% |
Similar Demographics by 3 or more Vehicles in Household
Demographics Similar to Chileans by 3 or more Vehicles in Household
In terms of 3 or more vehicles in household, the demographic groups most similar to Chileans are Yugoslavian (19.7%, a difference of 0.010%), Estonian (19.7%, a difference of 0.020%), Immigrants from Costa Rica (19.7%, a difference of 0.090%), Immigrants from Cameroon (19.7%, a difference of 0.17%), and Immigrants from Guatemala (19.7%, a difference of 0.21%).
| Demographics | Rating | Rank | 3 or more Vehicles in Household |
| Thais | 71.1 /100 | #156 | Good 19.8% |
| Hungarians | 70.5 /100 | #157 | Good 19.8% |
| Armenians | 68.8 /100 | #158 | Good 19.8% |
| Immigrants | Pakistan | 68.2 /100 | #159 | Good 19.8% |
| Immigrants | Lebanon | 67.6 /100 | #160 | Good 19.8% |
| Immigrants | Guatemala | 65.6 /100 | #161 | Good 19.7% |
| Estonians | 63.2 /100 | #162 | Good 19.7% |
| Chileans | 63.0 /100 | #163 | Good 19.7% |
| Yugoslavians | 62.9 /100 | #164 | Good 19.7% |
| Immigrants | Costa Rica | 61.9 /100 | #165 | Good 19.7% |
| Immigrants | Cameroon | 60.9 /100 | #166 | Good 19.7% |
| Ukrainians | 58.9 /100 | #167 | Average 19.6% |
| Peruvians | 58.8 /100 | #168 | Average 19.6% |
| Immigrants | Denmark | 57.6 /100 | #169 | Average 19.6% |
| Iraqis | 56.0 /100 | #170 | Average 19.6% |
Demographics Similar to Immigrants from Moldova by 3 or more Vehicles in Household
In terms of 3 or more vehicles in household, the demographic groups most similar to Immigrants from Moldova are Serbian (19.1%, a difference of 0.040%), Tsimshian (19.1%, a difference of 0.080%), Kenyan (19.1%, a difference of 0.11%), Central American Indian (19.0%, a difference of 0.15%), and South American Indian (19.1%, a difference of 0.18%).
| Demographics | Rating | Rank | 3 or more Vehicles in Household |
| Immigrants | Kuwait | 26.1 /100 | #188 | Fair 19.1% |
| Indians (Asian) | 26.0 /100 | #189 | Fair 19.1% |
| Immigrants | Zimbabwe | 25.5 /100 | #190 | Fair 19.1% |
| South American Indians | 25.4 /100 | #191 | Fair 19.1% |
| Kenyans | 24.7 /100 | #192 | Fair 19.1% |
| Tsimshian | 24.4 /100 | #193 | Fair 19.1% |
| Serbians | 24.0 /100 | #194 | Fair 19.1% |
| Immigrants | Moldova | 23.6 /100 | #195 | Fair 19.1% |
| Central American Indians | 22.2 /100 | #196 | Fair 19.0% |
| Immigrants | Japan | 22.0 /100 | #197 | Fair 19.0% |
| Egyptians | 19.5 /100 | #198 | Poor 19.0% |
| Immigrants | Norway | 19.0 /100 | #199 | Poor 19.0% |
| Argentineans | 18.2 /100 | #200 | Poor 18.9% |
| Arabs | 17.7 /100 | #201 | Poor 18.9% |
| Immigrants | Austria | 15.4 /100 | #202 | Poor 18.9% |