Sri Lankan vs Immigrants from Moldova 3 or more Vehicles in Household

COMPARE

Sri Lankan
Race
Ancestry
AfghanAfricanAlaska NativeAlaskan AthabascanAlbanianAleutAlsatianAmericanApacheArabArapahoArgentineanArmenianAssyrian/Chaldean/SyriacAustralianAustrianBahamianBangladeshiBarbadianBasqueBelgianBelizeanBermudanBhutaneseBlackfeetBolivianBrazilianBritishBritish West IndianBulgarianBurmeseCajunCambodianCanadianCape VerdeanCarpatho RusynCelticCentral AmericanCentral American IndianCherokeeCheyenneChickasawChileanChineseChippewaChoctawColombianColvilleComancheCosta RicanCreeCreekCroatianCrowCubanCypriotCzechCzechoslovakianDanishDelawareDominicanDutchDutch West IndianEastern EuropeanEcuadorianEgyptianEnglishEstonianEthiopianEuropeanFijianFilipinoFinnishFrenchFrench American IndianFrench CanadianGermanGerman RussianGhanaianGreekGuamanian/ChamorroGuatemalanGuyaneseHaitianHmongHonduranHopiHoumaHungarianIcelanderIndian (Asian)IndonesianInupiatIranianIraqiIrishIroquoisIsraeliItalianJamaicanJapaneseJordanianKenyanKiowaKoreanLaotianLatvianLebaneseLiberianLithuanianLumbeeLuxembourgerMacedonianMalaysianMalteseMarshalleseMenomineeMexicanMexican American IndianMongolianMoroccanNative HawaiianNavajoNepaleseNew ZealanderNicaraguanNigerianNorthern EuropeanNorwegianOkinawanOsageOttawaPaiutePakistaniPalestinianPanamanianParaguayanPennsylvania GermanPeruvianPimaPolishPortuguesePotawatomiPuebloPuerto RicanPuget Sound SalishRomanianRussianSalvadoranSamoanScandinavianScotch-IrishScottishSeminoleSenegaleseSerbianShoshoneSierra LeoneanSiouxSlavicSlovakSloveneSomaliSouth AfricanSouth AmericanSouth American IndianSoviet UnionSpaniardSpanishSpanish AmericanSpanish American IndianSri LankanSubsaharan AfricanSudaneseSwedishSwissSyrianTaiwaneseThaiTlingit-HaidaTohono O'OdhamTonganTrinidadian and TobagonianTsimshianTurkishU.S. Virgin IslanderUgandanUkrainianUruguayanUteVenezuelanVietnameseWelshWest IndianYakamaYaquiYugoslavianYumanYup'ikZimbabwean
Immigration
NonimmigrantsImmigrantsAfghanistanAfricaAlbaniaArgentinaArmeniaAsiaAustraliaAustriaBahamasBangladeshBarbadosBelarusBelgiumBelizeBoliviaBosnia and HerzegovinaBrazilBulgariaBurma/MyanmarCabo VerdeCambodiaCameroonCanadaCaribbeanCentral AmericaChileChinaColombiaCongoCosta RicaCroatiaCubaCzechoslovakiaDenmarkDominicaDominican RepublicEastern AfricaEastern AsiaEastern EuropeEcuadorEgyptEl SalvadorEnglandEritreaEthiopiaEuropeFijiFranceGermanyGhanaGreeceGrenadaGuatemalaGuyanaHaitiHondurasHong KongHungaryIndiaIndonesiaIranIraqIrelandIsraelItalyJamaicaJapanJordanKazakhstanKenyaKoreaKuwaitLaosLatin AmericaLatviaLebanonLiberiaLithuaniaMalaysiaMexicoMicronesiaMiddle AfricaMoroccoNepalNetherlandsNicaraguaNigeriaNorth AmericaNorth MacedoniaNorthern AfricaNorthern EuropeNorwayOceaniaPakistanPanamaPeruPhilippinesPolandPortugalRomaniaRussiaSaudi ArabiaScotlandSenegalSerbiaSierra LeoneSingaporeSomaliaSouth AfricaSouth AmericaSouth Central AsiaSouth Eastern AsiaSouthern EuropeSpainSri LankaSt. Vincent and the GrenadinesSudanSwedenSwitzerlandSyriaTaiwanThailandTrinidad and TobagoTurkeyUgandaUkraineUruguayUzbekistanVenezuelaVietnamWest IndiesWestern AfricaWestern AsiaWestern EuropeYemenZaireZimbabweAzores
Immigrants from Moldova
Race
Ancestry
AfghanAfricanAlaska NativeAlaskan AthabascanAlbanianAleutAlsatianAmericanApacheArabArapahoArgentineanArmenianAssyrian/Chaldean/SyriacAustralianAustrianBahamianBangladeshiBarbadianBasqueBelgianBelizeanBermudanBhutaneseBlackfeetBolivianBrazilianBritishBritish West IndianBulgarianBurmeseCajunCambodianCanadianCape VerdeanCarpatho RusynCelticCentral AmericanCentral American IndianCherokeeCheyenneChickasawChileanChineseChippewaChoctawColombianColvilleComancheCosta RicanCreeCreekCroatianCrowCubanCypriotCzechCzechoslovakianDanishDelawareDominicanDutchDutch West IndianEastern EuropeanEcuadorianEgyptianEnglishEstonianEthiopianEuropeanFijianFilipinoFinnishFrenchFrench American IndianFrench CanadianGermanGerman RussianGhanaianGreekGuamanian/ChamorroGuatemalanGuyaneseHaitianHmongHonduranHopiHoumaHungarianIcelanderIndian (Asian)IndonesianInupiatIranianIraqiIrishIroquoisIsraeliItalianJamaicanJapaneseJordanianKenyanKiowaKoreanLaotianLatvianLebaneseLiberianLithuanianLumbeeLuxembourgerMacedonianMalaysianMalteseMarshalleseMenomineeMexicanMexican American IndianMongolianMoroccanNative HawaiianNavajoNepaleseNew ZealanderNicaraguanNigerianNorthern EuropeanNorwegianOkinawanOsageOttawaPaiutePakistaniPalestinianPanamanianParaguayanPennsylvania GermanPeruvianPimaPolishPortuguesePotawatomiPuebloPuerto RicanPuget Sound SalishRomanianRussianSalvadoranSamoanScandinavianScotch-IrishScottishSeminoleSenegaleseSerbianShoshoneSierra LeoneanSiouxSlavicSlovakSloveneSomaliSouth AfricanSouth AmericanSouth American IndianSoviet UnionSpaniardSpanishSpanish AmericanSpanish American IndianSubsaharan AfricanSudaneseSwedishSwissSyrianTaiwaneseThaiTlingit-HaidaTohono O'OdhamTonganTrinidadian and TobagonianTsimshianTurkishU.S. Virgin IslanderUgandanUkrainianUruguayanUteVenezuelanVietnameseWelshWest IndianYakamaYaquiYugoslavianYumanYup'ikZimbabwean
Immigration
NonimmigrantsImmigrantsAfghanistanAfricaAlbaniaArgentinaArmeniaAsiaAustraliaAustriaBahamasBangladeshBarbadosBelarusBelgiumBelizeBoliviaBosnia and HerzegovinaBrazilBulgariaBurma/MyanmarCabo VerdeCambodiaCameroonCanadaCaribbeanCentral AmericaChileChinaColombiaCongoCosta RicaCroatiaCubaCzechoslovakiaDenmarkDominicaDominican RepublicEastern AfricaEastern AsiaEastern EuropeEcuadorEgyptEl SalvadorEnglandEritreaEthiopiaEuropeFijiFranceGermanyGhanaGreeceGrenadaGuatemalaGuyanaHaitiHondurasHong KongHungaryIndiaIndonesiaIranIraqIrelandIsraelItalyJamaicaJapanJordanKazakhstanKenyaKoreaKuwaitLaosLatin AmericaLatviaLebanonLiberiaLithuaniaMalaysiaMexicoMicronesiaMiddle AfricaMoldovaMoroccoNepalNetherlandsNicaraguaNigeriaNorth AmericaNorth MacedoniaNorthern AfricaNorthern EuropeNorwayOceaniaPakistanPanamaPeruPhilippinesPolandPortugalRomaniaRussiaSaudi ArabiaScotlandSenegalSerbiaSierra LeoneSingaporeSomaliaSouth AfricaSouth AmericaSouth Central AsiaSouth Eastern AsiaSouthern EuropeSpainSri LankaSt. Vincent and the GrenadinesSudanSwedenSwitzerlandSyriaTaiwanThailandTrinidad and TobagoTurkeyUgandaUkraineUruguayUzbekistanVenezuelaVietnamWest IndiesWestern AfricaWestern AsiaWestern EuropeYemenZaireZimbabweAzores
3 or more Vehicles in Household
Income
Poverty
Unemployment
Labor Participation
Family Structure
Vehicle Availability
Education Level
Disability

3 or more Vehicles in Household Comparison

Sri Lankans

Immigrants from Moldova

Exceptional
Fair
23.6%
3 OR MORE VEHICLES IN HOUSEHOLD
100.0/ 100
METRIC RATING
24th/ 347
METRIC RANK
19.1%
3 OR MORE VEHICLES IN HOUSEHOLD
23.6/ 100
METRIC RATING
195th/ 347
METRIC RANK

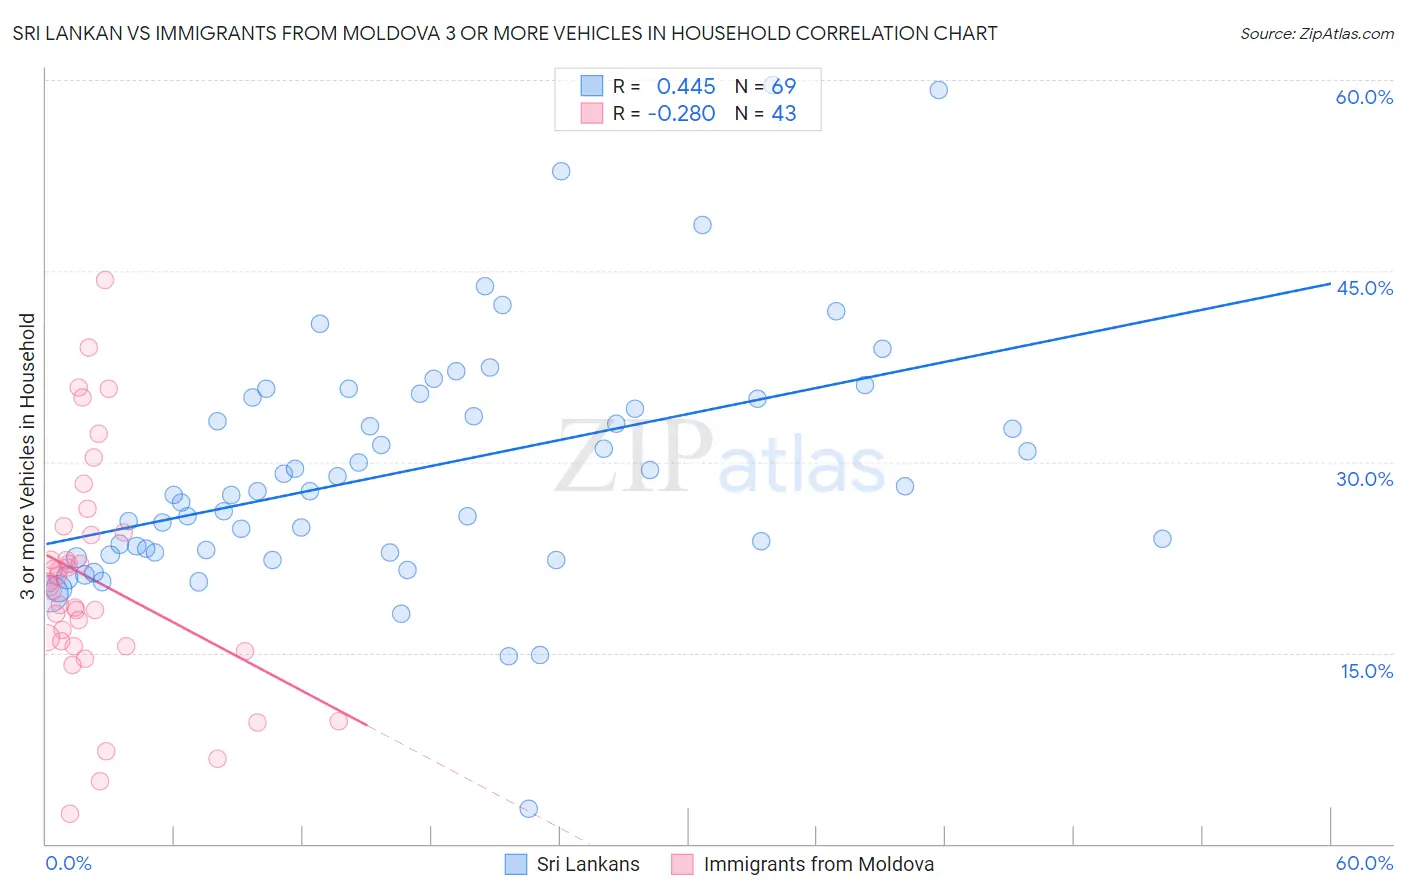
Sri Lankan vs Immigrants from Moldova 3 or more Vehicles in Household Correlation Chart

The statistical analysis conducted on geographies consisting of 439,958,447 people shows a moderate positive correlation between the proportion of Sri Lankans and percentage of households with 3 or more vehicles available in the United States with a correlation coefficient (R) of 0.445 and weighted average of 23.6%. Similarly, the statistical analysis conducted on geographies consisting of 124,372,944 people shows a weak negative correlation between the proportion of Immigrants from Moldova and percentage of households with 3 or more vehicles available in the United States with a correlation coefficient (R) of -0.280 and weighted average of 19.1%, a difference of 23.5%.
Sri Lankan vs Immigrants from Moldova 3 or more Vehicles in Household

3 or more Vehicles in Household Correlation Summary

MeasurementSri LankanImmigrants from Moldova
Minimum2.8%2.4%
Maximum59.6%44.3%
Range56.9%41.9%
Mean29.4%20.7%
Median27.7%20.2%
Interquartile 25% (IQ1)22.9%15.5%
Interquartile 75% (IQ3)35.0%24.5%
Interquartile Range (IQR)12.1%8.9%
Standard Deviation (Sample)9.7%9.0%
Standard Deviation (Population)9.7%8.9%

Similar Demographics by 3 or more Vehicles in Household

Demographics Similar to Sri Lankans by 3 or more Vehicles in Household

In terms of 3 or more vehicles in household, the demographic groups most similar to Sri Lankans are Scandinavian (23.6%, a difference of 0.26%), Immigrants from Central America (23.4%, a difference of 0.51%), Immigrants from Philippines (23.8%, a difference of 0.85%), Immigrants from Vietnam (23.8%, a difference of 0.91%), and Paiute (23.8%, a difference of 1.0%).
DemographicsRating | Rank3 or more Vehicles in Household
Koreans
100.0
/100
|
#17
Exceptional
24.1%
Norwegians
100.0
/100
|
#18
Exceptional
23.9%
Chinese
100.0
/100
|
#19
Exceptional
23.9%
Paiute
100.0
/100
|
#20
Exceptional
23.8%
Immigrants | Vietnam
100.0
/100
|
#21
Exceptional
23.8%
Immigrants | Philippines
100.0
/100
|
#22
Exceptional
23.8%
Scandinavians
100.0
/100
|
#23
Exceptional
23.6%
Sri Lankans
100.0
/100
|
#24
Exceptional
23.6%
Immigrants | Central America
100.0
/100
|
#25
Exceptional
23.4%
Mexican American Indians
100.0
/100
|
#26
Exceptional
23.3%
Guamanians/Chamorros
100.0
/100
|
#27
Exceptional
23.2%
Lumbee
100.0
/100
|
#28
Exceptional
23.1%
Spanish
100.0
/100
|
#29
Exceptional
23.1%
Immigrants | South Eastern Asia
100.0
/100
|
#30
Exceptional
23.1%
English
100.0
/100
|
#31
Exceptional
23.1%

Demographics Similar to Immigrants from Moldova by 3 or more Vehicles in Household

In terms of 3 or more vehicles in household, the demographic groups most similar to Immigrants from Moldova are Serbian (19.1%, a difference of 0.040%), Tsimshian (19.1%, a difference of 0.080%), Kenyan (19.1%, a difference of 0.11%), Central American Indian (19.0%, a difference of 0.15%), and South American Indian (19.1%, a difference of 0.18%).
DemographicsRating | Rank3 or more Vehicles in Household
Immigrants | Kuwait
26.1
/100
|
#188
Fair
19.1%
Indians (Asian)
26.0
/100
|
#189
Fair
19.1%
Immigrants | Zimbabwe
25.5
/100
|
#190
Fair
19.1%
South American Indians
25.4
/100
|
#191
Fair
19.1%
Kenyans
24.7
/100
|
#192
Fair
19.1%
Tsimshian
24.4
/100
|
#193
Fair
19.1%
Serbians
24.0
/100
|
#194
Fair
19.1%
Immigrants | Moldova
23.6
/100
|
#195
Fair
19.1%
Central American Indians
22.2
/100
|
#196
Fair
19.0%
Immigrants | Japan
22.0
/100
|
#197
Fair
19.0%
Egyptians
19.5
/100
|
#198
Poor
19.0%
Immigrants | Norway
19.0
/100
|
#199
Poor
19.0%
Argentineans
18.2
/100
|
#200
Poor
18.9%
Arabs
17.7
/100
|
#201
Poor
18.9%
Immigrants | Austria
15.4
/100
|
#202
Poor
18.9%