Chilean vs Immigrants from Bulgaria 3 or more Vehicles in Household
COMPARE
Chilean
Immigrants from Bulgaria
3 or more Vehicles in Household
3 or more Vehicles in Household Comparison
Chileans
Immigrants from Bulgaria
19.7%
3 OR MORE VEHICLES IN HOUSEHOLD
63.0/ 100
METRIC RATING
163rd/ 347
METRIC RANK
17.7%
3 OR MORE VEHICLES IN HOUSEHOLD
0.8/ 100
METRIC RATING
268th/ 347
METRIC RANK
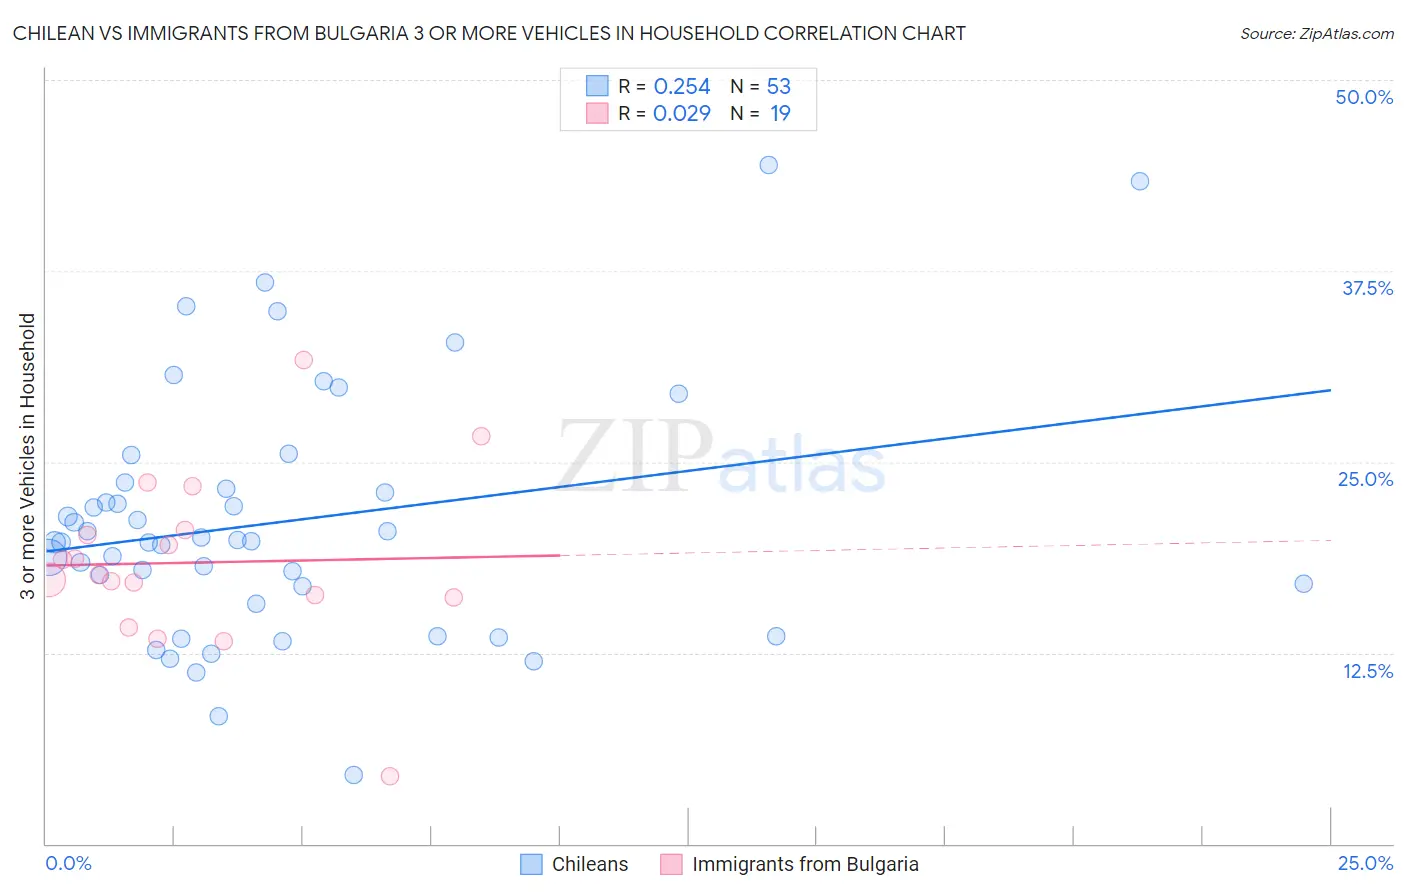
Chilean vs Immigrants from Bulgaria 3 or more Vehicles in Household Correlation Chart
The statistical analysis conducted on geographies consisting of 256,506,401 people shows a weak positive correlation between the proportion of Chileans and percentage of households with 3 or more vehicles available in the United States with a correlation coefficient (R) of 0.254 and weighted average of 19.7%. Similarly, the statistical analysis conducted on geographies consisting of 172,519,366 people shows no correlation between the proportion of Immigrants from Bulgaria and percentage of households with 3 or more vehicles available in the United States with a correlation coefficient (R) of 0.029 and weighted average of 17.7%, a difference of 11.2%.
3 or more Vehicles in Household Correlation Summary
| Measurement | Chilean | Immigrants from Bulgaria |
| Minimum | 4.5% | 4.4% |
| Maximum | 44.4% | 31.6% |
| Range | 40.0% | 27.3% |
| Mean | 21.1% | 18.4% |
| Median | 19.8% | 17.6% |
| Interquartile 25% (IQ1) | 16.3% | 16.1% |
| Interquartile 75% (IQ3) | 23.4% | 20.5% |
| Interquartile Range (IQR) | 7.2% | 4.4% |
| Standard Deviation (Sample) | 8.2% | 5.7% |
| Standard Deviation (Population) | 8.1% | 5.5% |
Similar Demographics by 3 or more Vehicles in Household
Demographics Similar to Chileans by 3 or more Vehicles in Household
In terms of 3 or more vehicles in household, the demographic groups most similar to Chileans are Yugoslavian (19.7%, a difference of 0.010%), Estonian (19.7%, a difference of 0.020%), Immigrants from Costa Rica (19.7%, a difference of 0.090%), Immigrants from Cameroon (19.7%, a difference of 0.17%), and Immigrants from Guatemala (19.7%, a difference of 0.21%).
| Demographics | Rating | Rank | 3 or more Vehicles in Household |
| Thais | 71.1 /100 | #156 | Good 19.8% |
| Hungarians | 70.5 /100 | #157 | Good 19.8% |
| Armenians | 68.8 /100 | #158 | Good 19.8% |
| Immigrants | Pakistan | 68.2 /100 | #159 | Good 19.8% |
| Immigrants | Lebanon | 67.6 /100 | #160 | Good 19.8% |
| Immigrants | Guatemala | 65.6 /100 | #161 | Good 19.7% |
| Estonians | 63.2 /100 | #162 | Good 19.7% |
| Chileans | 63.0 /100 | #163 | Good 19.7% |
| Yugoslavians | 62.9 /100 | #164 | Good 19.7% |
| Immigrants | Costa Rica | 61.9 /100 | #165 | Good 19.7% |
| Immigrants | Cameroon | 60.9 /100 | #166 | Good 19.7% |
| Ukrainians | 58.9 /100 | #167 | Average 19.6% |
| Peruvians | 58.8 /100 | #168 | Average 19.6% |
| Immigrants | Denmark | 57.6 /100 | #169 | Average 19.6% |
| Iraqis | 56.0 /100 | #170 | Average 19.6% |
Demographics Similar to Immigrants from Bulgaria by 3 or more Vehicles in Household
In terms of 3 or more vehicles in household, the demographic groups most similar to Immigrants from Bulgaria are Immigrants from Venezuela (17.7%, a difference of 0.010%), Macedonian (17.7%, a difference of 0.070%), Immigrants from Panama (17.7%, a difference of 0.090%), Cambodian (17.8%, a difference of 0.23%), and Bermudan (17.8%, a difference of 0.26%).
| Demographics | Rating | Rank | 3 or more Vehicles in Household |
| Immigrants | Northern Africa | 0.9 /100 | #261 | Tragic 17.8% |
| Colombians | 0.9 /100 | #262 | Tragic 17.8% |
| Bermudans | 0.9 /100 | #263 | Tragic 17.8% |
| Cambodians | 0.9 /100 | #264 | Tragic 17.8% |
| Immigrants | Panama | 0.8 /100 | #265 | Tragic 17.7% |
| Macedonians | 0.8 /100 | #266 | Tragic 17.7% |
| Immigrants | Venezuela | 0.8 /100 | #267 | Tragic 17.7% |
| Immigrants | Bulgaria | 0.8 /100 | #268 | Tragic 17.7% |
| Immigrants | France | 0.6 /100 | #269 | Tragic 17.6% |
| Immigrants | Nepal | 0.6 /100 | #270 | Tragic 17.6% |
| South Americans | 0.6 /100 | #271 | Tragic 17.6% |
| Immigrants | Africa | 0.5 /100 | #272 | Tragic 17.6% |
| Immigrants | Sudan | 0.5 /100 | #273 | Tragic 17.6% |
| Immigrants | Bosnia and Herzegovina | 0.5 /100 | #274 | Tragic 17.5% |
| Immigrants | Ukraine | 0.4 /100 | #275 | Tragic 17.5% |