Cajun vs Immigrants from Moldova 3 or more Vehicles in Household
COMPARE
Cajun
Immigrants from Moldova
3 or more Vehicles in Household
3 or more Vehicles in Household Comparison
Cajuns
Immigrants from Moldova
19.3%
3 OR MORE VEHICLES IN HOUSEHOLD
36.0/ 100
METRIC RATING
183rd/ 347
METRIC RANK
19.1%
3 OR MORE VEHICLES IN HOUSEHOLD
23.6/ 100
METRIC RATING
195th/ 347
METRIC RANK
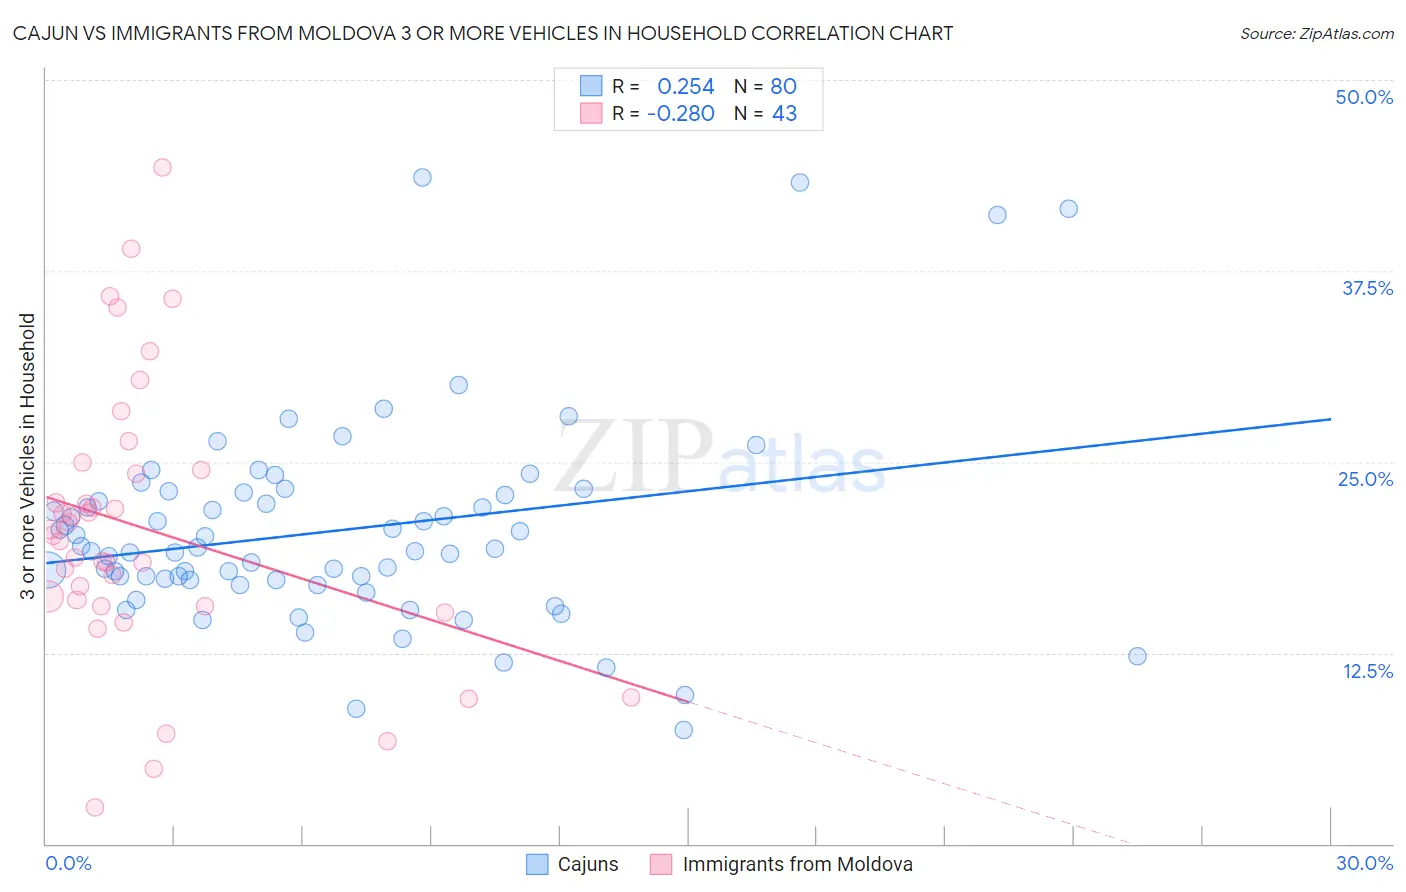
Cajun vs Immigrants from Moldova 3 or more Vehicles in Household Correlation Chart
The statistical analysis conducted on geographies consisting of 149,681,438 people shows a weak positive correlation between the proportion of Cajuns and percentage of households with 3 or more vehicles available in the United States with a correlation coefficient (R) of 0.254 and weighted average of 19.3%. Similarly, the statistical analysis conducted on geographies consisting of 124,372,944 people shows a weak negative correlation between the proportion of Immigrants from Moldova and percentage of households with 3 or more vehicles available in the United States with a correlation coefficient (R) of -0.280 and weighted average of 19.1%, a difference of 1.1%.
3 or more Vehicles in Household Correlation Summary
| Measurement | Cajun | Immigrants from Moldova |
| Minimum | 7.4% | 2.4% |
| Maximum | 43.7% | 44.3% |
| Range | 36.2% | 41.9% |
| Mean | 20.5% | 20.7% |
| Median | 19.2% | 20.2% |
| Interquartile 25% (IQ1) | 17.2% | 15.5% |
| Interquartile 75% (IQ3) | 22.9% | 24.5% |
| Interquartile Range (IQR) | 5.7% | 8.9% |
| Standard Deviation (Sample) | 6.7% | 9.0% |
| Standard Deviation (Population) | 6.7% | 8.9% |
Demographics Similar to Cajuns and Immigrants from Moldova by 3 or more Vehicles in Household
In terms of 3 or more vehicles in household, the demographic groups most similar to Cajuns are Latvian (19.3%, a difference of 0.020%), Cuban (19.3%, a difference of 0.050%), Romanian (19.3%, a difference of 0.090%), South African (19.3%, a difference of 0.13%), and Immigrants from South Central Asia (19.3%, a difference of 0.24%). Similarly, the demographic groups most similar to Immigrants from Moldova are Serbian (19.1%, a difference of 0.040%), Tsimshian (19.1%, a difference of 0.080%), Kenyan (19.1%, a difference of 0.11%), Central American Indian (19.0%, a difference of 0.15%), and South American Indian (19.1%, a difference of 0.18%).
| Demographics | Rating | Rank | 3 or more Vehicles in Household |
| Immigrants | South Central Asia | 38.9 /100 | #179 | Fair 19.3% |
| South Africans | 37.5 /100 | #180 | Fair 19.3% |
| Romanians | 37.1 /100 | #181 | Fair 19.3% |
| Cubans | 36.6 /100 | #182 | Fair 19.3% |
| Cajuns | 36.0 /100 | #183 | Fair 19.3% |
| Latvians | 35.7 /100 | #184 | Fair 19.3% |
| Immigrants | Sri Lanka | 30.7 /100 | #185 | Fair 19.2% |
| Immigrants | Sweden | 29.0 /100 | #186 | Fair 19.2% |
| Immigrants | Hong Kong | 28.3 /100 | #187 | Fair 19.2% |
| Immigrants | Kuwait | 26.1 /100 | #188 | Fair 19.1% |
| Indians (Asian) | 26.0 /100 | #189 | Fair 19.1% |
| Immigrants | Zimbabwe | 25.5 /100 | #190 | Fair 19.1% |
| South American Indians | 25.4 /100 | #191 | Fair 19.1% |
| Kenyans | 24.7 /100 | #192 | Fair 19.1% |
| Tsimshian | 24.4 /100 | #193 | Fair 19.1% |
| Serbians | 24.0 /100 | #194 | Fair 19.1% |
| Immigrants | Moldova | 23.6 /100 | #195 | Fair 19.1% |
| Central American Indians | 22.2 /100 | #196 | Fair 19.0% |
| Immigrants | Japan | 22.0 /100 | #197 | Fair 19.0% |
| Egyptians | 19.5 /100 | #198 | Poor 19.0% |
| Immigrants | Norway | 19.0 /100 | #199 | Poor 19.0% |