Cape Verdean vs Immigrants from Moldova 3 or more Vehicles in Household
COMPARE
Cape Verdean
Immigrants from Moldova
3 or more Vehicles in Household
3 or more Vehicles in Household Comparison
Cape Verdeans
Immigrants from Moldova
15.0%
3 OR MORE VEHICLES IN HOUSEHOLD
0.0/ 100
METRIC RATING
319th/ 347
METRIC RANK
19.1%
3 OR MORE VEHICLES IN HOUSEHOLD
23.6/ 100
METRIC RATING
195th/ 347
METRIC RANK
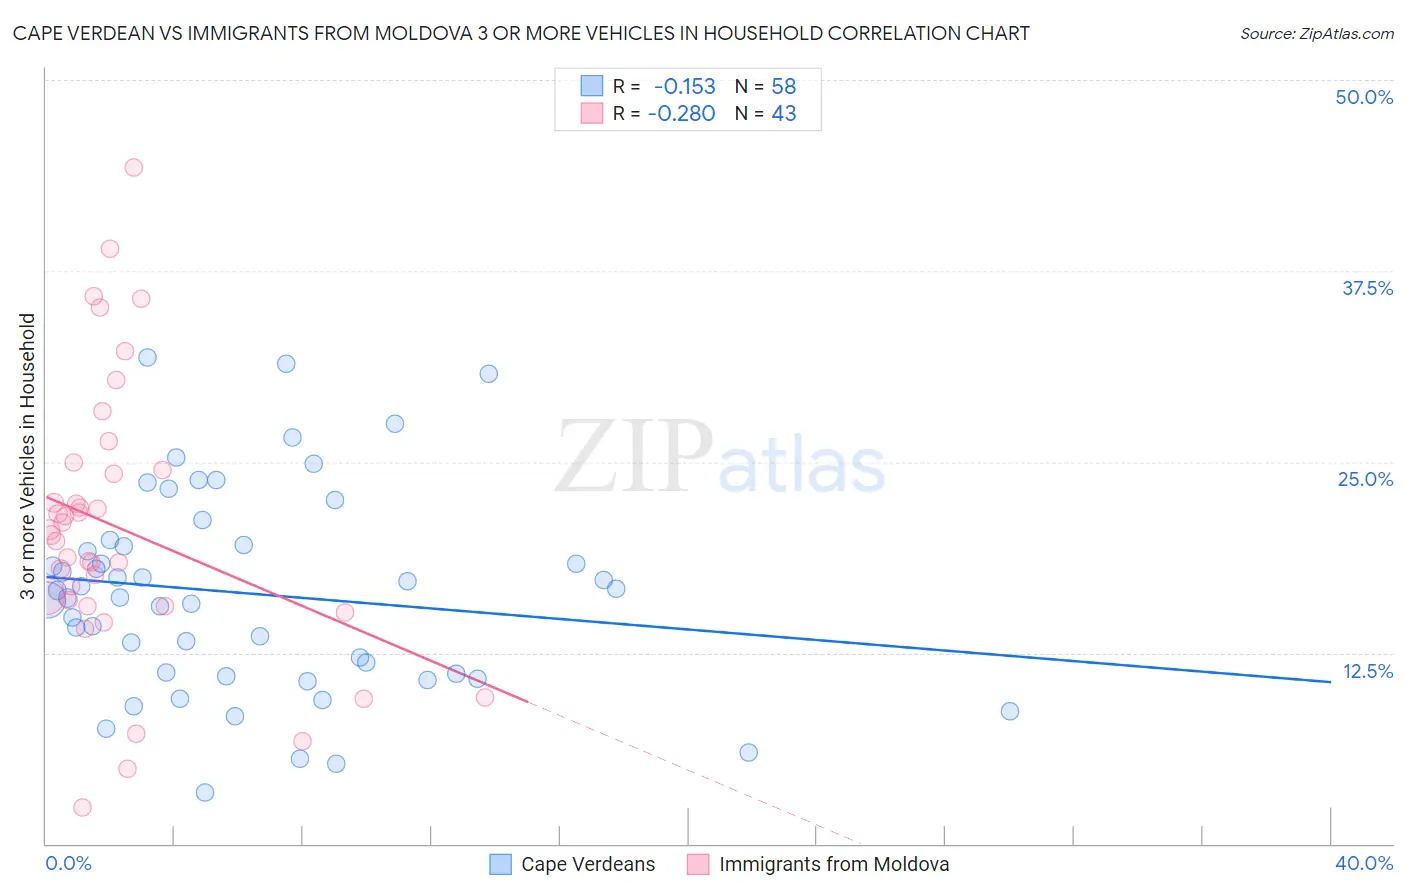
Cape Verdean vs Immigrants from Moldova 3 or more Vehicles in Household Correlation Chart
The statistical analysis conducted on geographies consisting of 107,543,887 people shows a poor negative correlation between the proportion of Cape Verdeans and percentage of households with 3 or more vehicles available in the United States with a correlation coefficient (R) of -0.153 and weighted average of 15.0%. Similarly, the statistical analysis conducted on geographies consisting of 124,372,944 people shows a weak negative correlation between the proportion of Immigrants from Moldova and percentage of households with 3 or more vehicles available in the United States with a correlation coefficient (R) of -0.280 and weighted average of 19.1%, a difference of 27.2%.
3 or more Vehicles in Household Correlation Summary
| Measurement | Cape Verdean | Immigrants from Moldova |
| Minimum | 3.3% | 2.4% |
| Maximum | 31.8% | 44.3% |
| Range | 28.5% | 41.9% |
| Mean | 16.4% | 20.7% |
| Median | 16.3% | 20.2% |
| Interquartile 25% (IQ1) | 11.2% | 15.5% |
| Interquartile 75% (IQ3) | 19.5% | 24.5% |
| Interquartile Range (IQR) | 8.4% | 8.9% |
| Standard Deviation (Sample) | 6.6% | 9.0% |
| Standard Deviation (Population) | 6.6% | 8.9% |
Similar Demographics by 3 or more Vehicles in Household
Demographics Similar to Cape Verdeans by 3 or more Vehicles in Household
In terms of 3 or more vehicles in household, the demographic groups most similar to Cape Verdeans are Yup'ik (14.8%, a difference of 1.1%), Immigrants from Haiti (15.2%, a difference of 1.2%), Jamaican (15.2%, a difference of 1.4%), Immigrants from Jamaica (14.7%, a difference of 2.2%), and Immigrants from West Indies (14.6%, a difference of 2.5%).
| Demographics | Rating | Rank | 3 or more Vehicles in Household |
| Puerto Ricans | 0.0 /100 | #312 | Tragic 15.6% |
| Immigrants | Israel | 0.0 /100 | #313 | Tragic 15.6% |
| Immigrants | Belarus | 0.0 /100 | #314 | Tragic 15.5% |
| Haitians | 0.0 /100 | #315 | Tragic 15.5% |
| U.S. Virgin Islanders | 0.0 /100 | #316 | Tragic 15.4% |
| Jamaicans | 0.0 /100 | #317 | Tragic 15.2% |
| Immigrants | Haiti | 0.0 /100 | #318 | Tragic 15.2% |
| Cape Verdeans | 0.0 /100 | #319 | Tragic 15.0% |
| Yup'ik | 0.0 /100 | #320 | Tragic 14.8% |
| Immigrants | Jamaica | 0.0 /100 | #321 | Tragic 14.7% |
| Immigrants | West Indies | 0.0 /100 | #322 | Tragic 14.6% |
| Immigrants | Caribbean | 0.0 /100 | #323 | Tragic 14.6% |
| Immigrants | Yemen | 0.0 /100 | #324 | Tragic 14.2% |
| Senegalese | 0.0 /100 | #325 | Tragic 14.2% |
| Soviet Union | 0.0 /100 | #326 | Tragic 14.2% |
Demographics Similar to Immigrants from Moldova by 3 or more Vehicles in Household
In terms of 3 or more vehicles in household, the demographic groups most similar to Immigrants from Moldova are Serbian (19.1%, a difference of 0.040%), Tsimshian (19.1%, a difference of 0.080%), Kenyan (19.1%, a difference of 0.11%), Central American Indian (19.0%, a difference of 0.15%), and South American Indian (19.1%, a difference of 0.18%).
| Demographics | Rating | Rank | 3 or more Vehicles in Household |
| Immigrants | Kuwait | 26.1 /100 | #188 | Fair 19.1% |
| Indians (Asian) | 26.0 /100 | #189 | Fair 19.1% |
| Immigrants | Zimbabwe | 25.5 /100 | #190 | Fair 19.1% |
| South American Indians | 25.4 /100 | #191 | Fair 19.1% |
| Kenyans | 24.7 /100 | #192 | Fair 19.1% |
| Tsimshian | 24.4 /100 | #193 | Fair 19.1% |
| Serbians | 24.0 /100 | #194 | Fair 19.1% |
| Immigrants | Moldova | 23.6 /100 | #195 | Fair 19.1% |
| Central American Indians | 22.2 /100 | #196 | Fair 19.0% |
| Immigrants | Japan | 22.0 /100 | #197 | Fair 19.0% |
| Egyptians | 19.5 /100 | #198 | Poor 19.0% |
| Immigrants | Norway | 19.0 /100 | #199 | Poor 19.0% |
| Argentineans | 18.2 /100 | #200 | Poor 18.9% |
| Arabs | 17.7 /100 | #201 | Poor 18.9% |
| Immigrants | Austria | 15.4 /100 | #202 | Poor 18.9% |