Arab vs Immigrants from Moldova 3 or more Vehicles in Household
COMPARE
Arab
Immigrants from Moldova
3 or more Vehicles in Household
3 or more Vehicles in Household Comparison
Arabs
Immigrants from Moldova
18.9%
3 OR MORE VEHICLES IN HOUSEHOLD
17.7/ 100
METRIC RATING
201st/ 347
METRIC RANK
19.1%
3 OR MORE VEHICLES IN HOUSEHOLD
23.6/ 100
METRIC RATING
195th/ 347
METRIC RANK
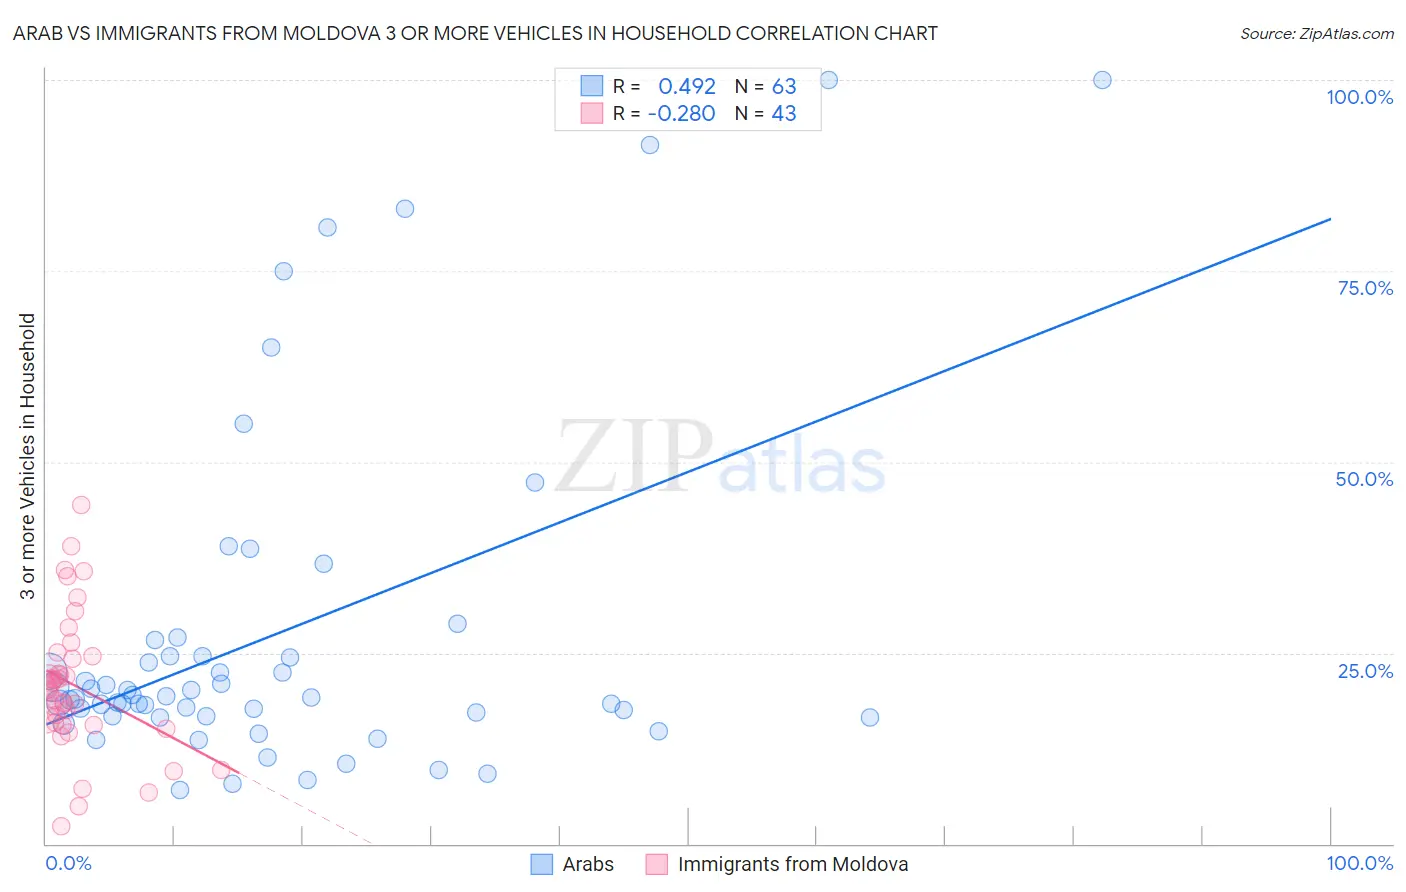
Arab vs Immigrants from Moldova 3 or more Vehicles in Household Correlation Chart
The statistical analysis conducted on geographies consisting of 486,191,468 people shows a moderate positive correlation between the proportion of Arabs and percentage of households with 3 or more vehicles available in the United States with a correlation coefficient (R) of 0.492 and weighted average of 18.9%. Similarly, the statistical analysis conducted on geographies consisting of 124,372,944 people shows a weak negative correlation between the proportion of Immigrants from Moldova and percentage of households with 3 or more vehicles available in the United States with a correlation coefficient (R) of -0.280 and weighted average of 19.1%, a difference of 0.70%.
3 or more Vehicles in Household Correlation Summary
| Measurement | Arab | Immigrants from Moldova |
| Minimum | 7.1% | 2.4% |
| Maximum | 100.0% | 44.3% |
| Range | 92.9% | 41.9% |
| Mean | 27.5% | 20.7% |
| Median | 19.1% | 20.2% |
| Interquartile 25% (IQ1) | 16.7% | 15.5% |
| Interquartile 75% (IQ3) | 24.6% | 24.5% |
| Interquartile Range (IQR) | 7.9% | 8.9% |
| Standard Deviation (Sample) | 22.5% | 9.0% |
| Standard Deviation (Population) | 22.3% | 8.9% |
Demographics Similar to Arabs and Immigrants from Moldova by 3 or more Vehicles in Household
In terms of 3 or more vehicles in household, the demographic groups most similar to Arabs are Argentinean (18.9%, a difference of 0.060%), Immigrants from Norway (19.0%, a difference of 0.16%), Egyptian (19.0%, a difference of 0.22%), Immigrants from Austria (18.9%, a difference of 0.33%), and Tohono O'odham (18.9%, a difference of 0.42%). Similarly, the demographic groups most similar to Immigrants from Moldova are Serbian (19.1%, a difference of 0.040%), Tsimshian (19.1%, a difference of 0.080%), Kenyan (19.1%, a difference of 0.11%), Central American Indian (19.0%, a difference of 0.15%), and South American Indian (19.1%, a difference of 0.18%).
| Demographics | Rating | Rank | 3 or more Vehicles in Household |
| Immigrants | Kuwait | 26.1 /100 | #188 | Fair 19.1% |
| Indians (Asian) | 26.0 /100 | #189 | Fair 19.1% |
| Immigrants | Zimbabwe | 25.5 /100 | #190 | Fair 19.1% |
| South American Indians | 25.4 /100 | #191 | Fair 19.1% |
| Kenyans | 24.7 /100 | #192 | Fair 19.1% |
| Tsimshian | 24.4 /100 | #193 | Fair 19.1% |
| Serbians | 24.0 /100 | #194 | Fair 19.1% |
| Immigrants | Moldova | 23.6 /100 | #195 | Fair 19.1% |
| Central American Indians | 22.2 /100 | #196 | Fair 19.0% |
| Immigrants | Japan | 22.0 /100 | #197 | Fair 19.0% |
| Egyptians | 19.5 /100 | #198 | Poor 19.0% |
| Immigrants | Norway | 19.0 /100 | #199 | Poor 19.0% |
| Argentineans | 18.2 /100 | #200 | Poor 18.9% |
| Arabs | 17.7 /100 | #201 | Poor 18.9% |
| Immigrants | Austria | 15.4 /100 | #202 | Poor 18.9% |
| Tohono O'odham | 14.8 /100 | #203 | Poor 18.9% |
| Immigrants | Romania | 14.6 /100 | #204 | Poor 18.9% |
| Russians | 14.2 /100 | #205 | Poor 18.8% |
| Immigrants | Eastern Asia | 14.1 /100 | #206 | Poor 18.8% |
| Immigrants | Chile | 13.6 /100 | #207 | Poor 18.8% |
| Immigrants | Burma/Myanmar | 13.6 /100 | #208 | Poor 18.8% |