Tsimshian vs Apache 3 or more Vehicles in Household
COMPARE
Tsimshian
Apache
3 or more Vehicles in Household
3 or more Vehicles in Household Comparison
Tsimshian
Apache
19.1%
3 OR MORE VEHICLES IN HOUSEHOLD
24.4/ 100
METRIC RATING
193rd/ 347
METRIC RANK
21.2%
3 OR MORE VEHICLES IN HOUSEHOLD
98.9/ 100
METRIC RATING
92nd/ 347
METRIC RANK
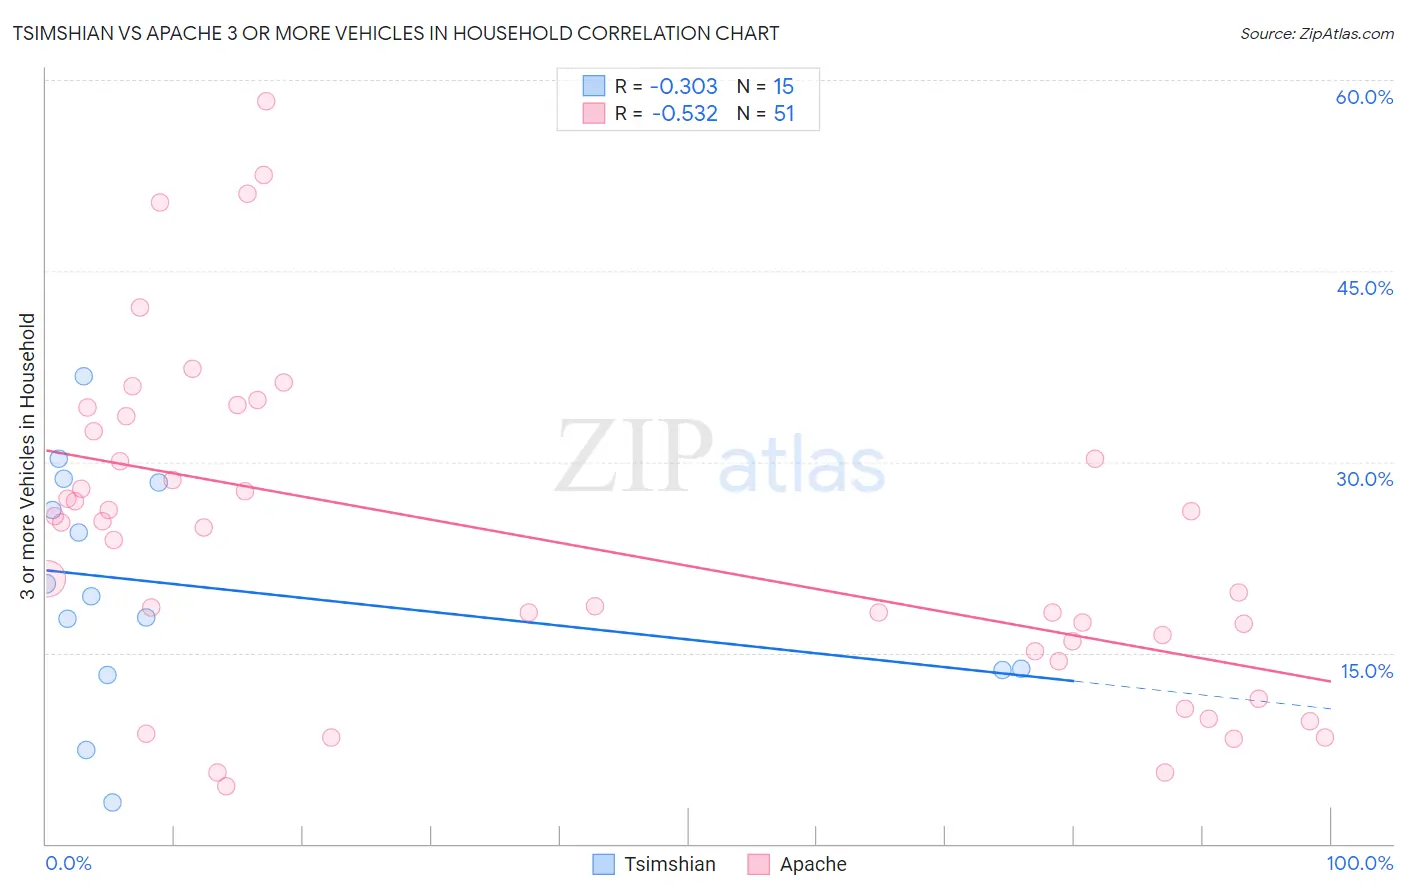
Tsimshian vs Apache 3 or more Vehicles in Household Correlation Chart
The statistical analysis conducted on geographies consisting of 15,626,544 people shows a mild negative correlation between the proportion of Tsimshian and percentage of households with 3 or more vehicles available in the United States with a correlation coefficient (R) of -0.303 and weighted average of 19.1%. Similarly, the statistical analysis conducted on geographies consisting of 231,026,513 people shows a substantial negative correlation between the proportion of Apache and percentage of households with 3 or more vehicles available in the United States with a correlation coefficient (R) of -0.532 and weighted average of 21.2%, a difference of 10.9%.
3 or more Vehicles in Household Correlation Summary
| Measurement | Tsimshian | Apache |
| Minimum | 3.2% | 4.5% |
| Maximum | 36.7% | 58.3% |
| Range | 33.5% | 53.9% |
| Mean | 20.1% | 24.1% |
| Median | 19.4% | 24.8% |
| Interquartile 25% (IQ1) | 13.6% | 15.1% |
| Interquartile 75% (IQ3) | 28.4% | 32.4% |
| Interquartile Range (IQR) | 14.8% | 17.3% |
| Standard Deviation (Sample) | 9.1% | 12.8% |
| Standard Deviation (Population) | 8.8% | 12.7% |
Similar Demographics by 3 or more Vehicles in Household
Demographics Similar to Tsimshian by 3 or more Vehicles in Household
In terms of 3 or more vehicles in household, the demographic groups most similar to Tsimshian are Kenyan (19.1%, a difference of 0.030%), Serbian (19.1%, a difference of 0.040%), Immigrants from Moldova (19.1%, a difference of 0.080%), South American Indian (19.1%, a difference of 0.10%), and Immigrants from Zimbabwe (19.1%, a difference of 0.11%).
| Demographics | Rating | Rank | 3 or more Vehicles in Household |
| Immigrants | Sweden | 29.0 /100 | #186 | Fair 19.2% |
| Immigrants | Hong Kong | 28.3 /100 | #187 | Fair 19.2% |
| Immigrants | Kuwait | 26.1 /100 | #188 | Fair 19.1% |
| Indians (Asian) | 26.0 /100 | #189 | Fair 19.1% |
| Immigrants | Zimbabwe | 25.5 /100 | #190 | Fair 19.1% |
| South American Indians | 25.4 /100 | #191 | Fair 19.1% |
| Kenyans | 24.7 /100 | #192 | Fair 19.1% |
| Tsimshian | 24.4 /100 | #193 | Fair 19.1% |
| Serbians | 24.0 /100 | #194 | Fair 19.1% |
| Immigrants | Moldova | 23.6 /100 | #195 | Fair 19.1% |
| Central American Indians | 22.2 /100 | #196 | Fair 19.0% |
| Immigrants | Japan | 22.0 /100 | #197 | Fair 19.0% |
| Egyptians | 19.5 /100 | #198 | Poor 19.0% |
| Immigrants | Norway | 19.0 /100 | #199 | Poor 19.0% |
| Argentineans | 18.2 /100 | #200 | Poor 18.9% |
Demographics Similar to Apache by 3 or more Vehicles in Household
In terms of 3 or more vehicles in household, the demographic groups most similar to Apache are Belgian (21.2%, a difference of 0.080%), Immigrants from Indonesia (21.1%, a difference of 0.20%), Immigrants from Afghanistan (21.2%, a difference of 0.41%), Immigrants from Cambodia (21.1%, a difference of 0.43%), and Pakistani (21.0%, a difference of 0.57%).
| Demographics | Rating | Rank | 3 or more Vehicles in Household |
| Laotians | 99.6 /100 | #85 | Exceptional 21.5% |
| Delaware | 99.6 /100 | #86 | Exceptional 21.5% |
| Immigrants | Azores | 99.5 /100 | #87 | Exceptional 21.5% |
| French | 99.4 /100 | #88 | Exceptional 21.4% |
| Marshallese | 99.2 /100 | #89 | Exceptional 21.3% |
| Immigrants | Afghanistan | 99.1 /100 | #90 | Exceptional 21.2% |
| Belgians | 98.9 /100 | #91 | Exceptional 21.2% |
| Apache | 98.9 /100 | #92 | Exceptional 21.2% |
| Immigrants | Indonesia | 98.8 /100 | #93 | Exceptional 21.1% |
| Immigrants | Cambodia | 98.6 /100 | #94 | Exceptional 21.1% |
| Pakistanis | 98.5 /100 | #95 | Exceptional 21.0% |
| Cree | 98.4 /100 | #96 | Exceptional 21.0% |
| Canadians | 98.3 /100 | #97 | Exceptional 21.0% |
| Hmong | 98.2 /100 | #98 | Exceptional 21.0% |
| Alaska Natives | 98.2 /100 | #99 | Exceptional 21.0% |