Immigrants from West Indies vs Immigrants from Ghana 3 or more Vehicles in Household
COMPARE
Immigrants from West Indies
Immigrants from Ghana
3 or more Vehicles in Household
3 or more Vehicles in Household Comparison
Immigrants from West Indies
Immigrants from Ghana
14.6%
3 OR MORE VEHICLES IN HOUSEHOLD
0.0/ 100
METRIC RATING
322nd/ 347
METRIC RANK
16.2%
3 OR MORE VEHICLES IN HOUSEHOLD
0.0/ 100
METRIC RATING
307th/ 347
METRIC RANK
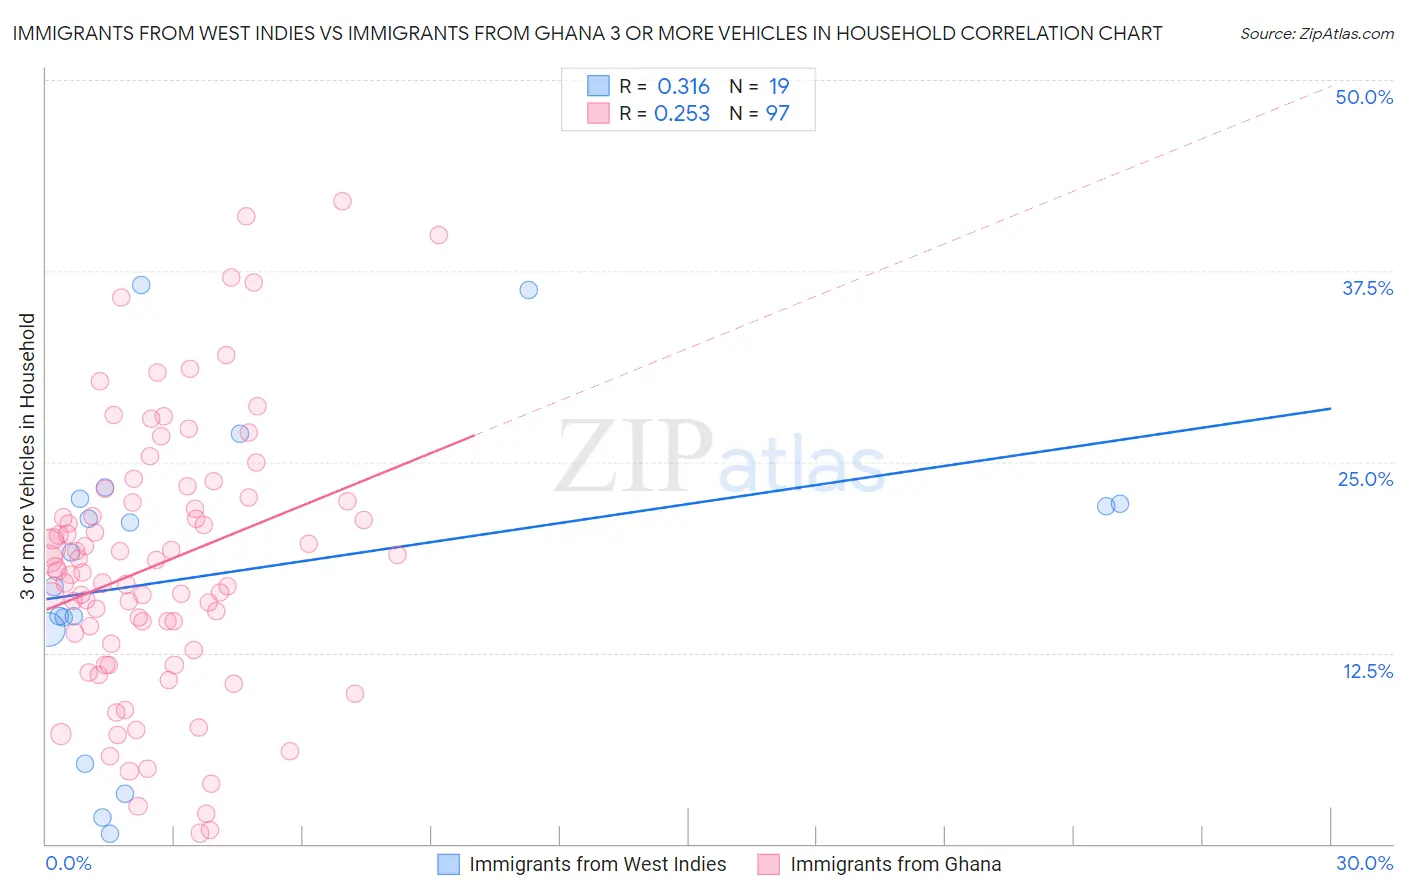
Immigrants from West Indies vs Immigrants from Ghana 3 or more Vehicles in Household Correlation Chart
The statistical analysis conducted on geographies consisting of 72,454,628 people shows a mild positive correlation between the proportion of Immigrants from West Indies and percentage of households with 3 or more vehicles available in the United States with a correlation coefficient (R) of 0.316 and weighted average of 14.6%. Similarly, the statistical analysis conducted on geographies consisting of 199,771,460 people shows a weak positive correlation between the proportion of Immigrants from Ghana and percentage of households with 3 or more vehicles available in the United States with a correlation coefficient (R) of 0.253 and weighted average of 16.2%, a difference of 10.4%.
3 or more Vehicles in Household Correlation Summary
| Measurement | Immigrants from West Indies | Immigrants from Ghana |
| Minimum | 0.69% | 0.70% |
| Maximum | 36.6% | 42.0% |
| Range | 35.9% | 41.3% |
| Mean | 17.8% | 18.3% |
| Median | 19.1% | 17.8% |
| Interquartile 25% (IQ1) | 14.0% | 12.9% |
| Interquartile 75% (IQ3) | 22.6% | 22.6% |
| Interquartile Range (IQR) | 8.5% | 9.7% |
| Standard Deviation (Sample) | 10.1% | 8.8% |
| Standard Deviation (Population) | 9.9% | 8.8% |
Demographics Similar to Immigrants from West Indies and Immigrants from Ghana by 3 or more Vehicles in Household
In terms of 3 or more vehicles in household, the demographic groups most similar to Immigrants from West Indies are Immigrants from Jamaica (14.7%, a difference of 0.31%), Immigrants from Caribbean (14.6%, a difference of 0.44%), Yup'ik (14.8%, a difference of 1.4%), Cape Verdean (15.0%, a difference of 2.5%), and Immigrants from Yemen (14.2%, a difference of 2.8%). Similarly, the demographic groups most similar to Immigrants from Ghana are Somali (16.2%, a difference of 0.15%), Houma (16.1%, a difference of 0.59%), Immigrants from Morocco (16.3%, a difference of 0.96%), Ghanaian (16.4%, a difference of 1.2%), and Immigrants from Somalia (15.9%, a difference of 1.5%).
| Demographics | Rating | Rank | 3 or more Vehicles in Household |
| Ghanaians | 0.0 /100 | #304 | Tragic 16.4% |
| Immigrants | Morocco | 0.0 /100 | #305 | Tragic 16.3% |
| Somalis | 0.0 /100 | #306 | Tragic 16.2% |
| Immigrants | Ghana | 0.0 /100 | #307 | Tragic 16.2% |
| Houma | 0.0 /100 | #308 | Tragic 16.1% |
| Immigrants | Somalia | 0.0 /100 | #309 | Tragic 15.9% |
| Moroccans | 0.0 /100 | #310 | Tragic 15.9% |
| Albanians | 0.0 /100 | #311 | Tragic 15.8% |
| Puerto Ricans | 0.0 /100 | #312 | Tragic 15.6% |
| Immigrants | Israel | 0.0 /100 | #313 | Tragic 15.6% |
| Immigrants | Belarus | 0.0 /100 | #314 | Tragic 15.5% |
| Haitians | 0.0 /100 | #315 | Tragic 15.5% |
| U.S. Virgin Islanders | 0.0 /100 | #316 | Tragic 15.4% |
| Jamaicans | 0.0 /100 | #317 | Tragic 15.2% |
| Immigrants | Haiti | 0.0 /100 | #318 | Tragic 15.2% |
| Cape Verdeans | 0.0 /100 | #319 | Tragic 15.0% |
| Yup'ik | 0.0 /100 | #320 | Tragic 14.8% |
| Immigrants | Jamaica | 0.0 /100 | #321 | Tragic 14.7% |
| Immigrants | West Indies | 0.0 /100 | #322 | Tragic 14.6% |
| Immigrants | Caribbean | 0.0 /100 | #323 | Tragic 14.6% |
| Immigrants | Yemen | 0.0 /100 | #324 | Tragic 14.2% |