Belizean vs Immigrants from Ghana Divorced or Separated
COMPARE
Belizean
Immigrants from Ghana
Divorced or Separated
Divorced or Separated Comparison
Belizeans
Immigrants from Ghana
12.1%
DIVORCED OR SEPARATED
37.7/ 100
METRIC RATING
187th/ 347
METRIC RANK
12.2%
DIVORCED OR SEPARATED
18.8/ 100
METRIC RATING
208th/ 347
METRIC RANK
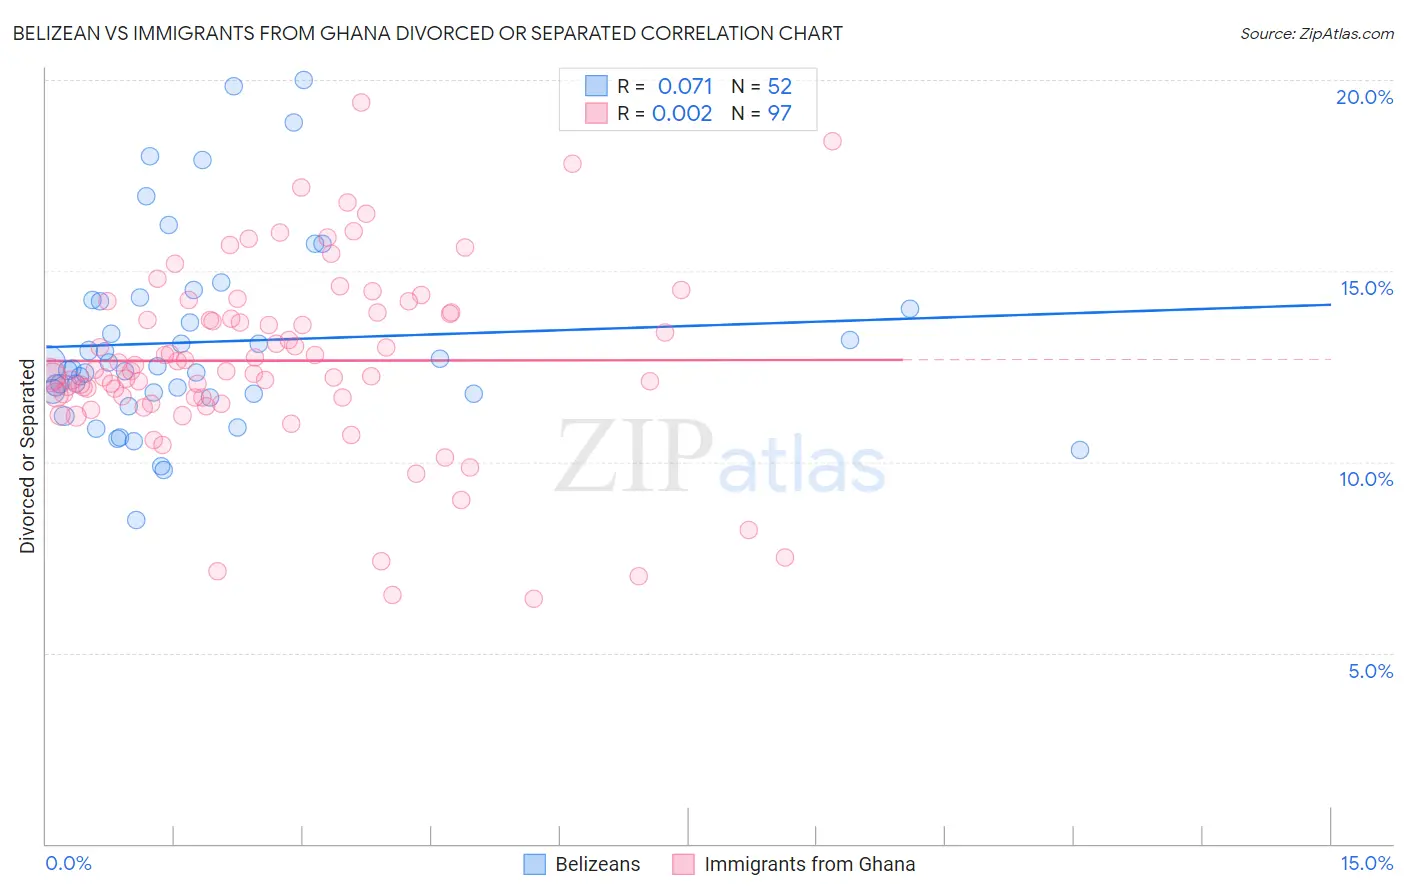
Belizean vs Immigrants from Ghana Divorced or Separated Correlation Chart
The statistical analysis conducted on geographies consisting of 144,199,730 people shows a slight positive correlation between the proportion of Belizeans and percentage of population currently divorced or separated in the United States with a correlation coefficient (R) of 0.071 and weighted average of 12.1%. Similarly, the statistical analysis conducted on geographies consisting of 199,867,447 people shows no correlation between the proportion of Immigrants from Ghana and percentage of population currently divorced or separated in the United States with a correlation coefficient (R) of 0.002 and weighted average of 12.2%, a difference of 0.83%.
Divorced or Separated Correlation Summary
| Measurement | Belizean | Immigrants from Ghana |
| Minimum | 8.5% | 6.4% |
| Maximum | 20.0% | 19.4% |
| Range | 11.5% | 13.0% |
| Mean | 13.1% | 12.7% |
| Median | 12.5% | 12.4% |
| Interquartile 25% (IQ1) | 11.8% | 11.7% |
| Interquartile 75% (IQ3) | 14.2% | 13.9% |
| Interquartile Range (IQR) | 2.4% | 2.2% |
| Standard Deviation (Sample) | 2.5% | 2.4% |
| Standard Deviation (Population) | 2.5% | 2.4% |
Similar Demographics by Divorced or Separated
Demographics Similar to Belizeans by Divorced or Separated
In terms of divorced or separated, the demographic groups most similar to Belizeans are Immigrants from Belize (12.1%, a difference of 0.0%), Immigrants from Chile (12.1%, a difference of 0.050%), Sierra Leonean (12.1%, a difference of 0.080%), Immigrants from Nigeria (12.1%, a difference of 0.10%), and Moroccan (12.1%, a difference of 0.11%).
| Demographics | Rating | Rank | Divorced or Separated |
| Barbadians | 45.0 /100 | #180 | Average 12.1% |
| Immigrants | Canada | 44.0 /100 | #181 | Average 12.1% |
| Immigrants | Ethiopia | 43.1 /100 | #182 | Average 12.1% |
| Immigrants | Central America | 42.9 /100 | #183 | Average 12.1% |
| Immigrants | North America | 41.1 /100 | #184 | Average 12.1% |
| Immigrants | Nigeria | 40.5 /100 | #185 | Average 12.1% |
| Immigrants | Chile | 39.0 /100 | #186 | Fair 12.1% |
| Belizeans | 37.7 /100 | #187 | Fair 12.1% |
| Immigrants | Belize | 37.6 /100 | #188 | Fair 12.1% |
| Sierra Leoneans | 35.5 /100 | #189 | Fair 12.1% |
| Moroccans | 34.8 /100 | #190 | Fair 12.1% |
| Swedes | 34.4 /100 | #191 | Fair 12.1% |
| Norwegians | 33.2 /100 | #192 | Fair 12.1% |
| Immigrants | Thailand | 32.5 /100 | #193 | Fair 12.1% |
| Immigrants | Eritrea | 31.9 /100 | #194 | Fair 12.1% |
Demographics Similar to Immigrants from Ghana by Divorced or Separated
In terms of divorced or separated, the demographic groups most similar to Immigrants from Ghana are Immigrants from Trinidad and Tobago (12.2%, a difference of 0.050%), Slavic (12.2%, a difference of 0.11%), Slovak (12.2%, a difference of 0.12%), Mexican (12.2%, a difference of 0.12%), and Immigrants from Costa Rica (12.2%, a difference of 0.13%).
| Demographics | Rating | Rank | Divorced or Separated |
| Guatemalans | 26.9 /100 | #201 | Fair 12.2% |
| Portuguese | 23.5 /100 | #202 | Fair 12.2% |
| Immigrants | Guatemala | 23.2 /100 | #203 | Fair 12.2% |
| Kenyans | 21.8 /100 | #204 | Fair 12.2% |
| Immigrants | Costa Rica | 21.3 /100 | #205 | Fair 12.2% |
| Slovaks | 21.0 /100 | #206 | Fair 12.2% |
| Mexicans | 21.0 /100 | #207 | Fair 12.2% |
| Immigrants | Ghana | 18.8 /100 | #208 | Poor 12.2% |
| Immigrants | Trinidad and Tobago | 17.8 /100 | #209 | Poor 12.2% |
| Slavs | 17.0 /100 | #210 | Poor 12.2% |
| Trinidadians and Tobagonians | 16.6 /100 | #211 | Poor 12.2% |
| Immigrants | Kenya | 16.5 /100 | #212 | Poor 12.2% |
| Immigrants | Eastern Africa | 16.2 /100 | #213 | Poor 12.2% |
| Immigrants | Argentina | 15.5 /100 | #214 | Poor 12.2% |
| Europeans | 15.4 /100 | #215 | Poor 12.2% |