Belizean vs Immigrants from Ghana Disability Age 65 to 74
COMPARE
Belizean
Immigrants from Ghana
Disability Age 65 to 74
Disability Age 65 to 74 Comparison
Belizeans
Immigrants from Ghana
25.8%
DISABILITY AGE 65 TO 74
0.1/ 100
METRIC RATING
277th/ 347
METRIC RANK
24.5%
DISABILITY AGE 65 TO 74
3.0/ 100
METRIC RATING
238th/ 347
METRIC RANK
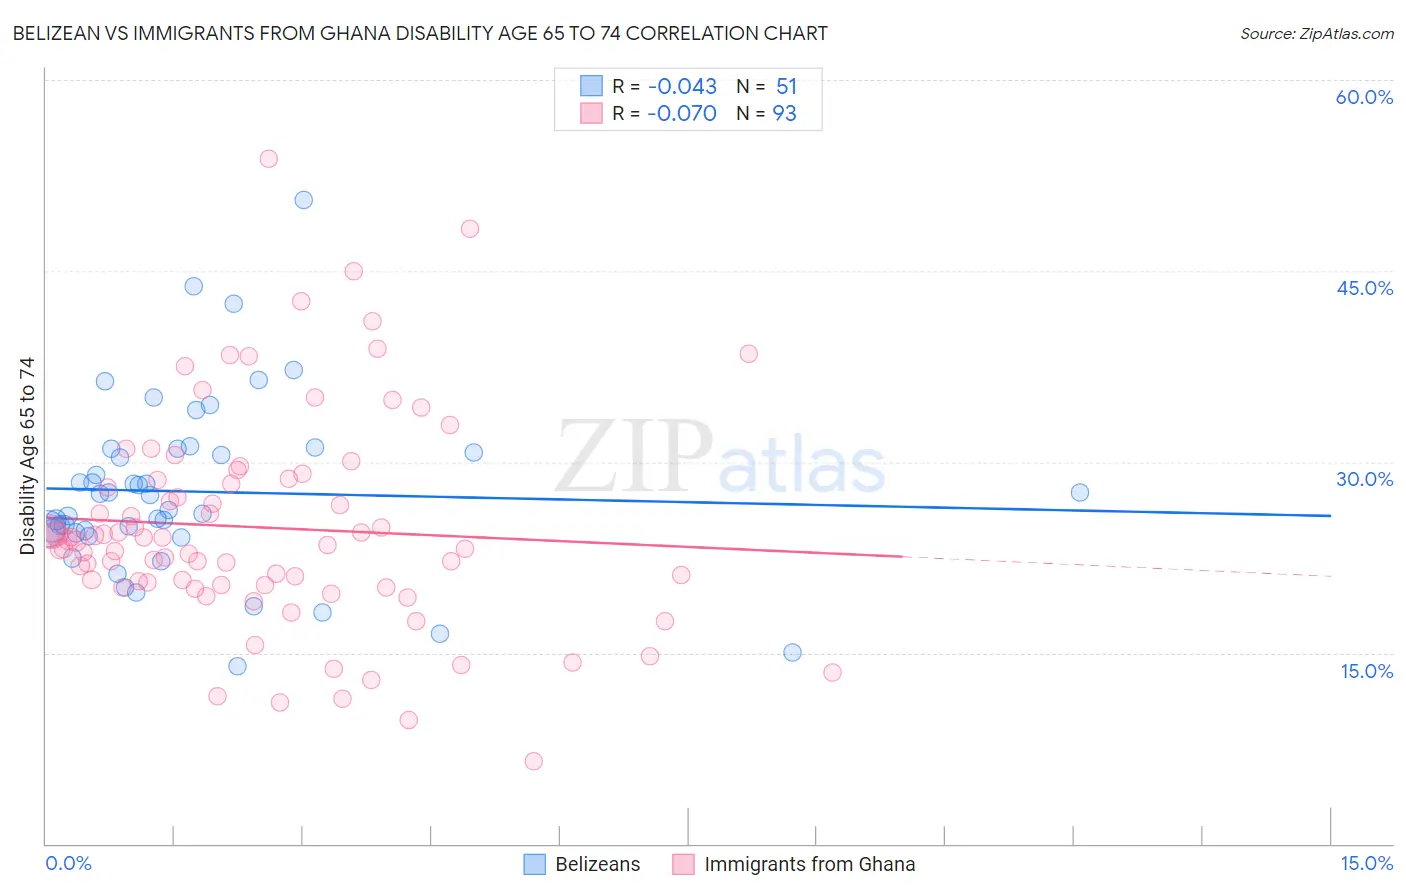
Belizean vs Immigrants from Ghana Disability Age 65 to 74 Correlation Chart
The statistical analysis conducted on geographies consisting of 144,105,664 people shows no correlation between the proportion of Belizeans and percentage of population with a disability between the ages 65 and 75 in the United States with a correlation coefficient (R) of -0.043 and weighted average of 25.8%. Similarly, the statistical analysis conducted on geographies consisting of 199,556,575 people shows a slight negative correlation between the proportion of Immigrants from Ghana and percentage of population with a disability between the ages 65 and 75 in the United States with a correlation coefficient (R) of -0.070 and weighted average of 24.5%, a difference of 5.4%.
Disability Age 65 to 74 Correlation Summary
| Measurement | Belizean | Immigrants from Ghana |
| Minimum | 14.0% | 6.5% |
| Maximum | 50.6% | 53.8% |
| Range | 36.6% | 47.4% |
| Mean | 27.7% | 24.8% |
| Median | 27.4% | 23.8% |
| Interquartile 25% (IQ1) | 24.4% | 20.3% |
| Interquartile 75% (IQ3) | 31.0% | 28.6% |
| Interquartile Range (IQR) | 6.6% | 8.3% |
| Standard Deviation (Sample) | 7.0% | 8.4% |
| Standard Deviation (Population) | 6.9% | 8.4% |
Similar Demographics by Disability Age 65 to 74
Demographics Similar to Belizeans by Disability Age 65 to 74
In terms of disability age 65 to 74, the demographic groups most similar to Belizeans are Immigrants from Belize (25.8%, a difference of 0.020%), French American Indian (25.8%, a difference of 0.090%), Honduran (25.8%, a difference of 0.10%), U.S. Virgin Islander (25.9%, a difference of 0.10%), and American (25.8%, a difference of 0.11%).
| Demographics | Rating | Rank | Disability Age 65 to 74 |
| Immigrants | Guatemala | 0.1 /100 | #270 | Tragic 25.7% |
| Immigrants | Liberia | 0.1 /100 | #271 | Tragic 25.7% |
| Immigrants | Dominica | 0.1 /100 | #272 | Tragic 25.7% |
| Japanese | 0.1 /100 | #273 | Tragic 25.7% |
| Americans | 0.1 /100 | #274 | Tragic 25.8% |
| Hondurans | 0.1 /100 | #275 | Tragic 25.8% |
| French American Indians | 0.1 /100 | #276 | Tragic 25.8% |
| Belizeans | 0.1 /100 | #277 | Tragic 25.8% |
| Immigrants | Belize | 0.1 /100 | #278 | Tragic 25.8% |
| U.S. Virgin Islanders | 0.1 /100 | #279 | Tragic 25.9% |
| Cree | 0.1 /100 | #280 | Tragic 25.9% |
| Immigrants | Honduras | 0.1 /100 | #281 | Tragic 25.9% |
| Delaware | 0.1 /100 | #282 | Tragic 25.9% |
| Spanish Americans | 0.0 /100 | #283 | Tragic 25.9% |
| Immigrants | Azores | 0.0 /100 | #284 | Tragic 26.0% |
Demographics Similar to Immigrants from Ghana by Disability Age 65 to 74
In terms of disability age 65 to 74, the demographic groups most similar to Immigrants from Ghana are West Indian (24.5%, a difference of 0.17%), Immigrants from Caribbean (24.6%, a difference of 0.22%), German Russian (24.4%, a difference of 0.27%), Scotch-Irish (24.4%, a difference of 0.31%), and Spaniard (24.6%, a difference of 0.31%).
| Demographics | Rating | Rank | Disability Age 65 to 74 |
| Immigrants | Thailand | 5.2 /100 | #231 | Tragic 24.3% |
| Immigrants | Zaire | 5.0 /100 | #232 | Tragic 24.3% |
| Bahamians | 4.5 /100 | #233 | Tragic 24.4% |
| Panamanians | 4.2 /100 | #234 | Tragic 24.4% |
| Scotch-Irish | 3.8 /100 | #235 | Tragic 24.4% |
| German Russians | 3.7 /100 | #236 | Tragic 24.4% |
| West Indians | 3.4 /100 | #237 | Tragic 24.5% |
| Immigrants | Ghana | 3.0 /100 | #238 | Tragic 24.5% |
| Immigrants | Caribbean | 2.6 /100 | #239 | Tragic 24.6% |
| Spaniards | 2.4 /100 | #240 | Tragic 24.6% |
| Immigrants | Western Africa | 2.3 /100 | #241 | Tragic 24.6% |
| Immigrants | Senegal | 2.2 /100 | #242 | Tragic 24.6% |
| Spanish | 2.2 /100 | #243 | Tragic 24.6% |
| Armenians | 2.0 /100 | #244 | Tragic 24.7% |
| British West Indians | 2.0 /100 | #245 | Tragic 24.7% |