Immigrants from Croatia vs Immigrants from Ghana 3 or more Vehicles in Household
COMPARE
Immigrants from Croatia
Immigrants from Ghana
3 or more Vehicles in Household
3 or more Vehicles in Household Comparison
Immigrants from Croatia
Immigrants from Ghana
17.2%
3 OR MORE VEHICLES IN HOUSEHOLD
0.2/ 100
METRIC RATING
285th/ 347
METRIC RANK
16.2%
3 OR MORE VEHICLES IN HOUSEHOLD
0.0/ 100
METRIC RATING
307th/ 347
METRIC RANK
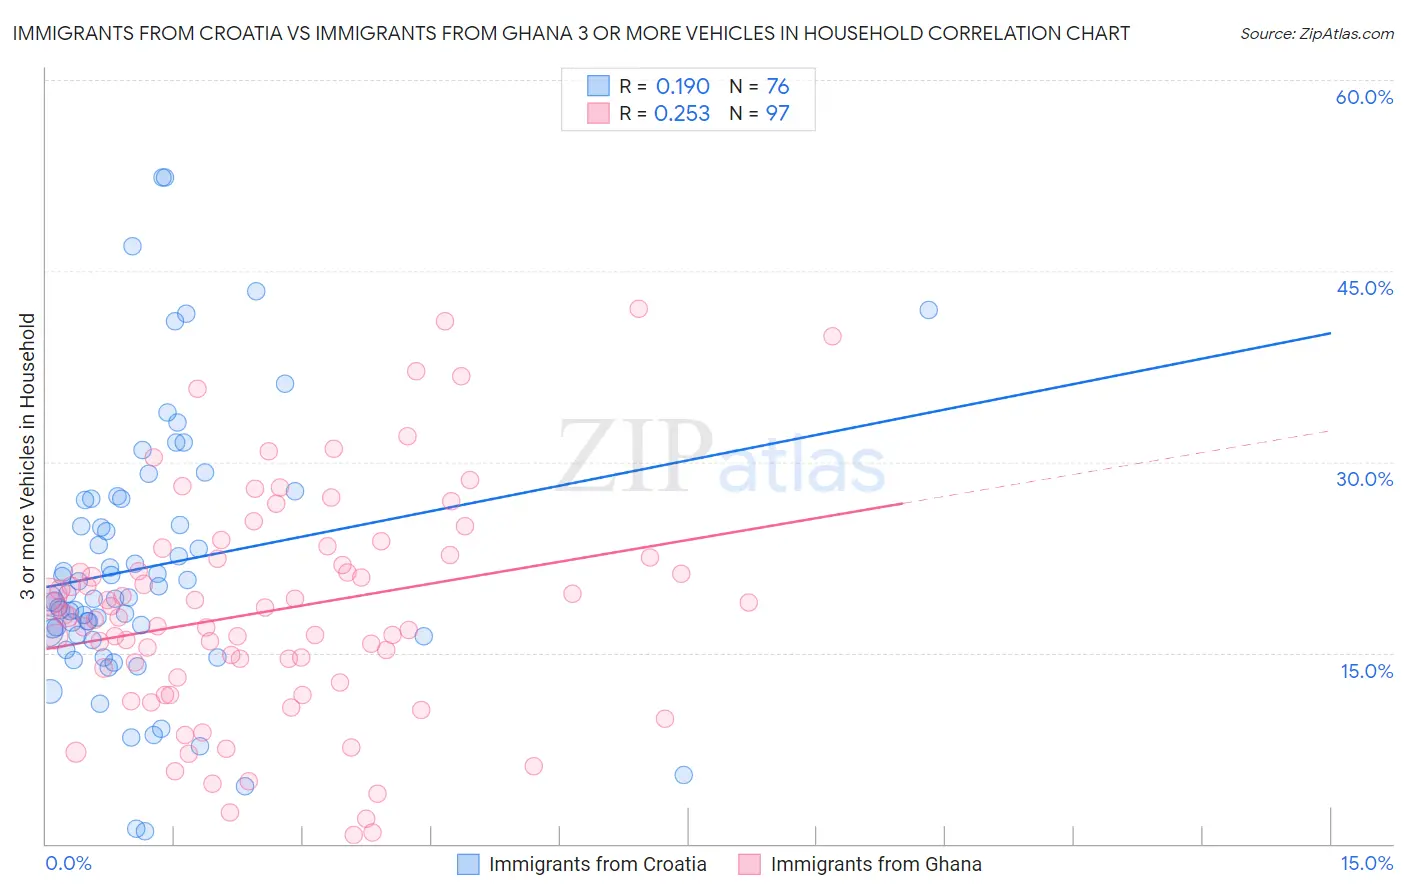
Immigrants from Croatia vs Immigrants from Ghana 3 or more Vehicles in Household Correlation Chart
The statistical analysis conducted on geographies consisting of 132,550,126 people shows a poor positive correlation between the proportion of Immigrants from Croatia and percentage of households with 3 or more vehicles available in the United States with a correlation coefficient (R) of 0.190 and weighted average of 17.2%. Similarly, the statistical analysis conducted on geographies consisting of 199,771,460 people shows a weak positive correlation between the proportion of Immigrants from Ghana and percentage of households with 3 or more vehicles available in the United States with a correlation coefficient (R) of 0.253 and weighted average of 16.2%, a difference of 6.4%.
3 or more Vehicles in Household Correlation Summary
| Measurement | Immigrants from Croatia | Immigrants from Ghana |
| Minimum | 0.97% | 0.70% |
| Maximum | 52.4% | 42.0% |
| Range | 51.4% | 41.3% |
| Mean | 21.7% | 18.3% |
| Median | 19.3% | 17.8% |
| Interquartile 25% (IQ1) | 16.4% | 12.9% |
| Interquartile 75% (IQ3) | 27.1% | 22.6% |
| Interquartile Range (IQR) | 10.7% | 9.7% |
| Standard Deviation (Sample) | 10.5% | 8.8% |
| Standard Deviation (Population) | 10.5% | 8.8% |
Similar Demographics by 3 or more Vehicles in Household
Demographics Similar to Immigrants from Croatia by 3 or more Vehicles in Household
In terms of 3 or more vehicles in household, the demographic groups most similar to Immigrants from Croatia are Menominee (17.2%, a difference of 0.060%), Immigrants from Brazil (17.1%, a difference of 0.36%), Immigrants from Uruguay (17.1%, a difference of 0.45%), Immigrants from Liberia (17.1%, a difference of 0.52%), and Immigrants from Colombia (17.3%, a difference of 0.73%).
| Demographics | Rating | Rank | 3 or more Vehicles in Household |
| Immigrants | Bahamas | 0.3 /100 | #278 | Tragic 17.4% |
| Immigrants | Kazakhstan | 0.3 /100 | #279 | Tragic 17.4% |
| Immigrants | Eastern Europe | 0.3 /100 | #280 | Tragic 17.4% |
| Immigrants | Latvia | 0.3 /100 | #281 | Tragic 17.4% |
| Immigrants | Ireland | 0.3 /100 | #282 | Tragic 17.3% |
| Blacks/African Americans | 0.3 /100 | #283 | Tragic 17.3% |
| Immigrants | Colombia | 0.3 /100 | #284 | Tragic 17.3% |
| Immigrants | Croatia | 0.2 /100 | #285 | Tragic 17.2% |
| Menominee | 0.2 /100 | #286 | Tragic 17.2% |
| Immigrants | Brazil | 0.2 /100 | #287 | Tragic 17.1% |
| Immigrants | Uruguay | 0.2 /100 | #288 | Tragic 17.1% |
| Immigrants | Liberia | 0.1 /100 | #289 | Tragic 17.1% |
| Liberians | 0.1 /100 | #290 | Tragic 17.0% |
| Immigrants | Congo | 0.1 /100 | #291 | Tragic 17.0% |
| Immigrants | Spain | 0.1 /100 | #292 | Tragic 17.0% |
Demographics Similar to Immigrants from Ghana by 3 or more Vehicles in Household
In terms of 3 or more vehicles in household, the demographic groups most similar to Immigrants from Ghana are Somali (16.2%, a difference of 0.15%), Houma (16.1%, a difference of 0.59%), Immigrants from Morocco (16.3%, a difference of 0.96%), Ghanaian (16.4%, a difference of 1.2%), and Immigrants from Somalia (15.9%, a difference of 1.5%).
| Demographics | Rating | Rank | 3 or more Vehicles in Household |
| Cypriots | 0.0 /100 | #300 | Tragic 16.6% |
| Paraguayans | 0.0 /100 | #301 | Tragic 16.6% |
| Immigrants | Greece | 0.0 /100 | #302 | Tragic 16.5% |
| Immigrants | Serbia | 0.0 /100 | #303 | Tragic 16.4% |
| Ghanaians | 0.0 /100 | #304 | Tragic 16.4% |
| Immigrants | Morocco | 0.0 /100 | #305 | Tragic 16.3% |
| Somalis | 0.0 /100 | #306 | Tragic 16.2% |
| Immigrants | Ghana | 0.0 /100 | #307 | Tragic 16.2% |
| Houma | 0.0 /100 | #308 | Tragic 16.1% |
| Immigrants | Somalia | 0.0 /100 | #309 | Tragic 15.9% |
| Moroccans | 0.0 /100 | #310 | Tragic 15.9% |
| Albanians | 0.0 /100 | #311 | Tragic 15.8% |
| Puerto Ricans | 0.0 /100 | #312 | Tragic 15.6% |
| Immigrants | Israel | 0.0 /100 | #313 | Tragic 15.6% |
| Immigrants | Belarus | 0.0 /100 | #314 | Tragic 15.5% |