Immigrants from Kuwait vs Croatian 3 or more Vehicles in Household
COMPARE
Immigrants from Kuwait
Croatian
3 or more Vehicles in Household
3 or more Vehicles in Household Comparison
Immigrants from Kuwait
Croatians
19.1%
3 OR MORE VEHICLES IN HOUSEHOLD
26.1/ 100
METRIC RATING
188th/ 347
METRIC RANK
20.6%
3 OR MORE VEHICLES IN HOUSEHOLD
94.9/ 100
METRIC RATING
117th/ 347
METRIC RANK
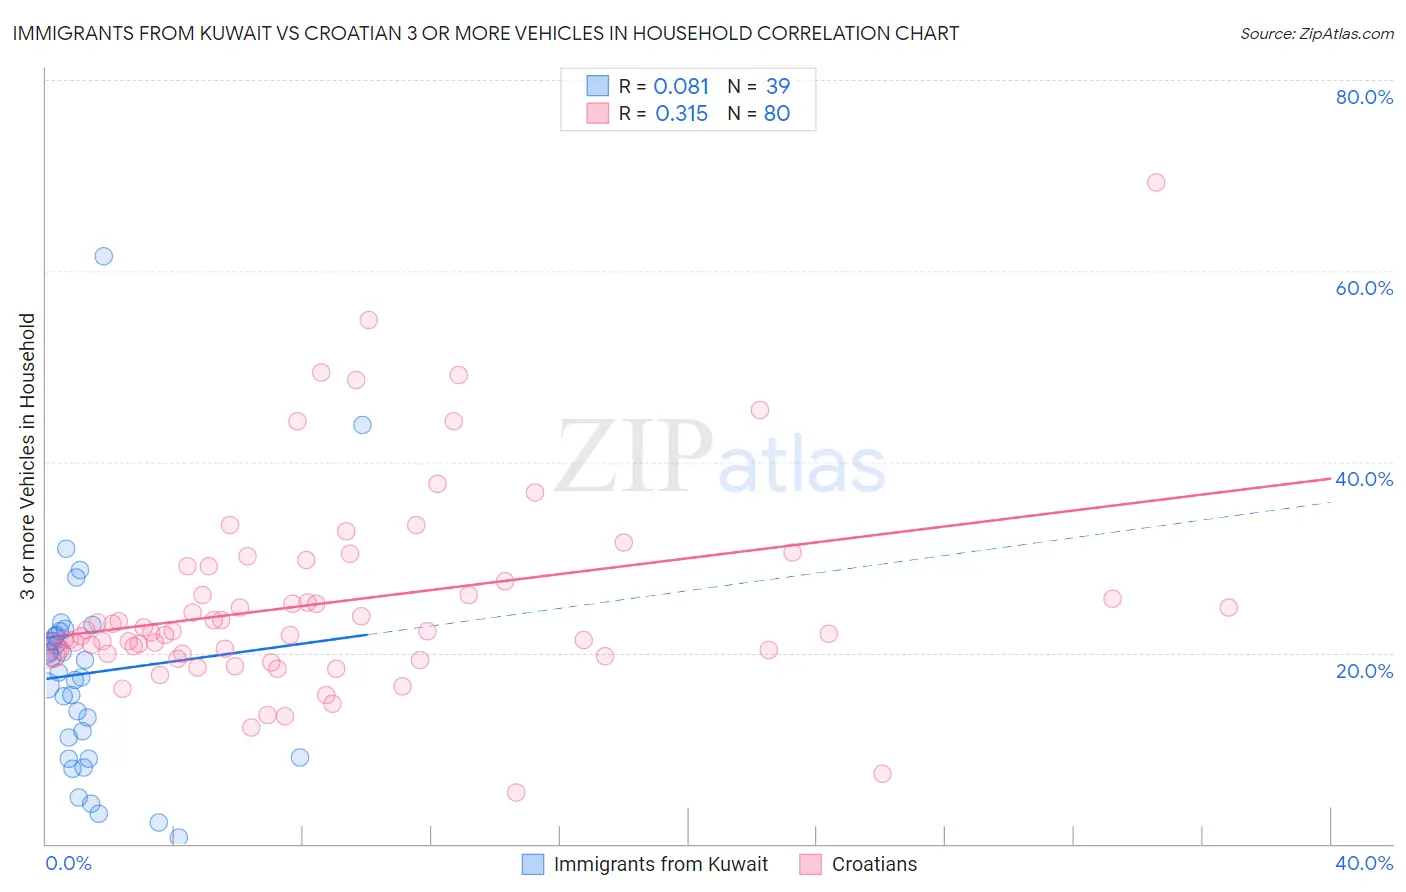
Immigrants from Kuwait vs Croatian 3 or more Vehicles in Household Correlation Chart
The statistical analysis conducted on geographies consisting of 136,861,731 people shows a slight positive correlation between the proportion of Immigrants from Kuwait and percentage of households with 3 or more vehicles available in the United States with a correlation coefficient (R) of 0.081 and weighted average of 19.1%. Similarly, the statistical analysis conducted on geographies consisting of 375,444,957 people shows a mild positive correlation between the proportion of Croatians and percentage of households with 3 or more vehicles available in the United States with a correlation coefficient (R) of 0.315 and weighted average of 20.6%, a difference of 7.6%.
3 or more Vehicles in Household Correlation Summary
| Measurement | Immigrants from Kuwait | Croatian |
| Minimum | 0.71% | 5.4% |
| Maximum | 61.6% | 69.3% |
| Range | 60.9% | 63.8% |
| Mean | 17.9% | 25.2% |
| Median | 17.9% | 22.2% |
| Interquartile 25% (IQ1) | 9.1% | 19.9% |
| Interquartile 75% (IQ3) | 21.8% | 28.3% |
| Interquartile Range (IQR) | 12.7% | 8.4% |
| Standard Deviation (Sample) | 11.3% | 10.5% |
| Standard Deviation (Population) | 11.1% | 10.4% |
Similar Demographics by 3 or more Vehicles in Household
Demographics Similar to Immigrants from Kuwait by 3 or more Vehicles in Household
In terms of 3 or more vehicles in household, the demographic groups most similar to Immigrants from Kuwait are Indian (Asian) (19.1%, a difference of 0.010%), Immigrants from Zimbabwe (19.1%, a difference of 0.060%), South American Indian (19.1%, a difference of 0.070%), Kenyan (19.1%, a difference of 0.14%), and Tsimshian (19.1%, a difference of 0.17%).
| Demographics | Rating | Rank | 3 or more Vehicles in Household |
| Romanians | 37.1 /100 | #181 | Fair 19.3% |
| Cubans | 36.6 /100 | #182 | Fair 19.3% |
| Cajuns | 36.0 /100 | #183 | Fair 19.3% |
| Latvians | 35.7 /100 | #184 | Fair 19.3% |
| Immigrants | Sri Lanka | 30.7 /100 | #185 | Fair 19.2% |
| Immigrants | Sweden | 29.0 /100 | #186 | Fair 19.2% |
| Immigrants | Hong Kong | 28.3 /100 | #187 | Fair 19.2% |
| Immigrants | Kuwait | 26.1 /100 | #188 | Fair 19.1% |
| Indians (Asian) | 26.0 /100 | #189 | Fair 19.1% |
| Immigrants | Zimbabwe | 25.5 /100 | #190 | Fair 19.1% |
| South American Indians | 25.4 /100 | #191 | Fair 19.1% |
| Kenyans | 24.7 /100 | #192 | Fair 19.1% |
| Tsimshian | 24.4 /100 | #193 | Fair 19.1% |
| Serbians | 24.0 /100 | #194 | Fair 19.1% |
| Immigrants | Moldova | 23.6 /100 | #195 | Fair 19.1% |
Demographics Similar to Croatians by 3 or more Vehicles in Household
In terms of 3 or more vehicles in household, the demographic groups most similar to Croatians are Italian (20.6%, a difference of 0.020%), French Canadian (20.6%, a difference of 0.050%), Costa Rican (20.6%, a difference of 0.11%), Immigrants from Latin America (20.5%, a difference of 0.15%), and Maltese (20.5%, a difference of 0.35%).
| Demographics | Rating | Rank | 3 or more Vehicles in Household |
| Asians | 96.8 /100 | #110 | Exceptional 20.8% |
| Immigrants | Micronesia | 96.7 /100 | #111 | Exceptional 20.7% |
| Nicaraguans | 96.2 /100 | #112 | Exceptional 20.7% |
| Immigrants | England | 96.2 /100 | #113 | Exceptional 20.7% |
| Burmese | 95.8 /100 | #114 | Exceptional 20.6% |
| French Canadians | 95.0 /100 | #115 | Exceptional 20.6% |
| Italians | 94.9 /100 | #116 | Exceptional 20.6% |
| Croatians | 94.9 /100 | #117 | Exceptional 20.6% |
| Costa Ricans | 94.6 /100 | #118 | Exceptional 20.6% |
| Immigrants | Latin America | 94.5 /100 | #119 | Exceptional 20.5% |
| Maltese | 93.9 /100 | #120 | Exceptional 20.5% |
| Immigrants | Thailand | 93.8 /100 | #121 | Exceptional 20.5% |
| German Russians | 93.7 /100 | #122 | Exceptional 20.5% |
| Immigrants | Korea | 93.7 /100 | #123 | Exceptional 20.5% |
| Central Americans | 93.1 /100 | #124 | Exceptional 20.5% |