Immigrants from Russia vs Croatian 3 or more Vehicles in Household
COMPARE
Immigrants from Russia
Croatian
3 or more Vehicles in Household
3 or more Vehicles in Household Comparison
Immigrants from Russia
Croatians
16.9%
3 OR MORE VEHICLES IN HOUSEHOLD
0.1/ 100
METRIC RATING
295th/ 347
METRIC RANK
20.6%
3 OR MORE VEHICLES IN HOUSEHOLD
94.9/ 100
METRIC RATING
117th/ 347
METRIC RANK
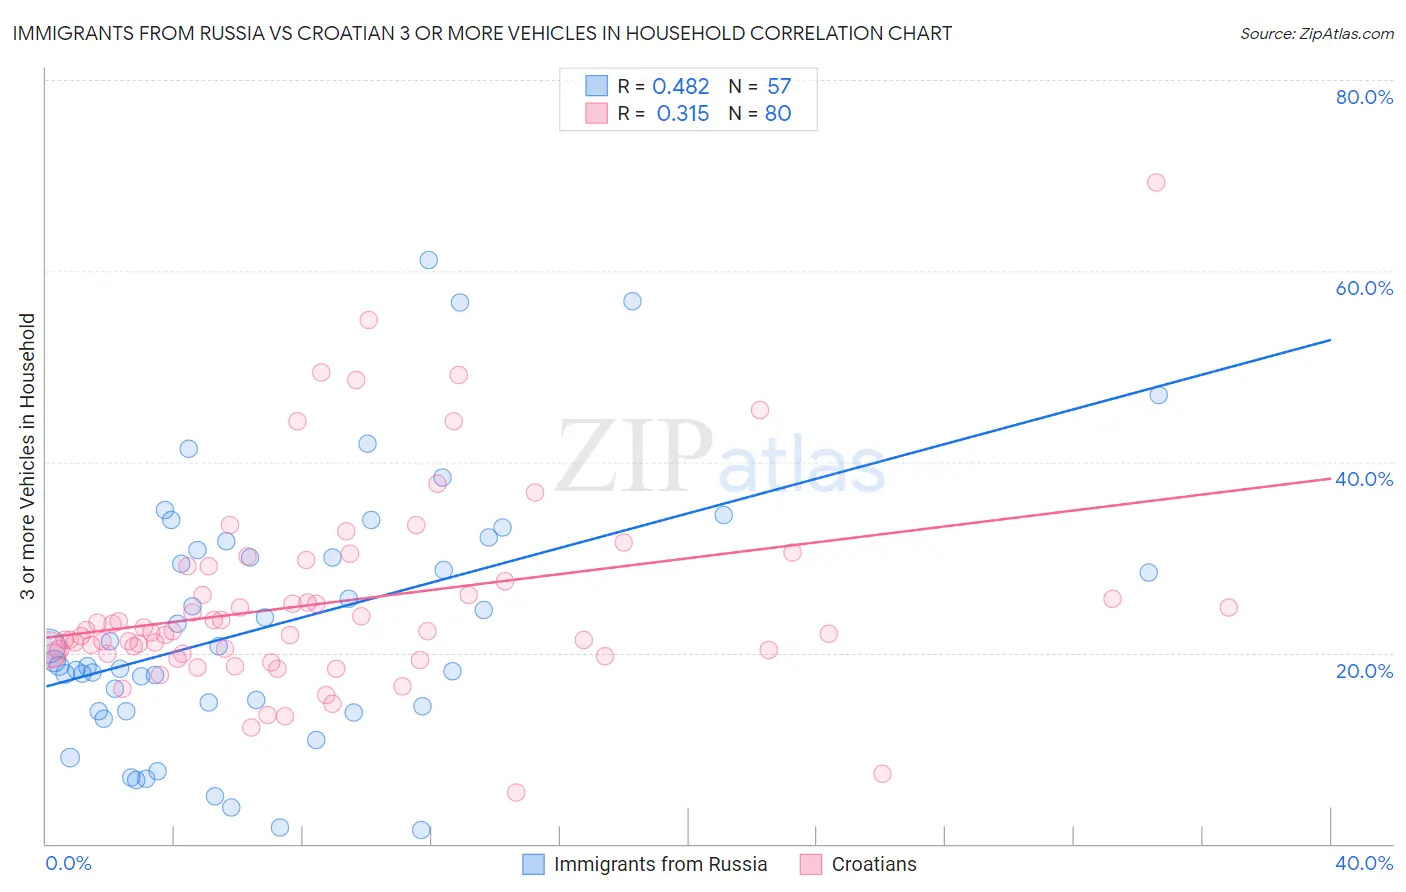
Immigrants from Russia vs Croatian 3 or more Vehicles in Household Correlation Chart
The statistical analysis conducted on geographies consisting of 347,621,563 people shows a moderate positive correlation between the proportion of Immigrants from Russia and percentage of households with 3 or more vehicles available in the United States with a correlation coefficient (R) of 0.482 and weighted average of 16.9%. Similarly, the statistical analysis conducted on geographies consisting of 375,444,957 people shows a mild positive correlation between the proportion of Croatians and percentage of households with 3 or more vehicles available in the United States with a correlation coefficient (R) of 0.315 and weighted average of 20.6%, a difference of 21.7%.
3 or more Vehicles in Household Correlation Summary
| Measurement | Immigrants from Russia | Croatian |
| Minimum | 1.4% | 5.4% |
| Maximum | 61.1% | 69.3% |
| Range | 59.7% | 63.8% |
| Mean | 23.0% | 25.2% |
| Median | 19.1% | 22.2% |
| Interquartile 25% (IQ1) | 14.1% | 19.9% |
| Interquartile 75% (IQ3) | 31.2% | 28.3% |
| Interquartile Range (IQR) | 17.1% | 8.4% |
| Standard Deviation (Sample) | 13.5% | 10.5% |
| Standard Deviation (Population) | 13.3% | 10.4% |
Similar Demographics by 3 or more Vehicles in Household
Demographics Similar to Immigrants from Russia by 3 or more Vehicles in Household
In terms of 3 or more vehicles in household, the demographic groups most similar to Immigrants from Russia are Immigrants from Western Africa (16.9%, a difference of 0.050%), Bahamian (16.9%, a difference of 0.16%), Immigrants from Spain (17.0%, a difference of 0.25%), Immigrants from Congo (17.0%, a difference of 0.36%), and Inupiat (16.9%, a difference of 0.36%).
| Demographics | Rating | Rank | 3 or more Vehicles in Household |
| Immigrants | Uruguay | 0.2 /100 | #288 | Tragic 17.1% |
| Immigrants | Liberia | 0.1 /100 | #289 | Tragic 17.1% |
| Liberians | 0.1 /100 | #290 | Tragic 17.0% |
| Immigrants | Congo | 0.1 /100 | #291 | Tragic 17.0% |
| Immigrants | Spain | 0.1 /100 | #292 | Tragic 17.0% |
| Bahamians | 0.1 /100 | #293 | Tragic 16.9% |
| Immigrants | Western Africa | 0.1 /100 | #294 | Tragic 16.9% |
| Immigrants | Russia | 0.1 /100 | #295 | Tragic 16.9% |
| Inupiat | 0.1 /100 | #296 | Tragic 16.9% |
| Israelis | 0.1 /100 | #297 | Tragic 16.8% |
| Immigrants | Zaire | 0.1 /100 | #298 | Tragic 16.7% |
| Immigrants | South America | 0.1 /100 | #299 | Tragic 16.7% |
| Cypriots | 0.0 /100 | #300 | Tragic 16.6% |
| Paraguayans | 0.0 /100 | #301 | Tragic 16.6% |
| Immigrants | Greece | 0.0 /100 | #302 | Tragic 16.5% |
Demographics Similar to Croatians by 3 or more Vehicles in Household
In terms of 3 or more vehicles in household, the demographic groups most similar to Croatians are Italian (20.6%, a difference of 0.020%), French Canadian (20.6%, a difference of 0.050%), Costa Rican (20.6%, a difference of 0.11%), Immigrants from Latin America (20.5%, a difference of 0.15%), and Maltese (20.5%, a difference of 0.35%).
| Demographics | Rating | Rank | 3 or more Vehicles in Household |
| Asians | 96.8 /100 | #110 | Exceptional 20.8% |
| Immigrants | Micronesia | 96.7 /100 | #111 | Exceptional 20.7% |
| Nicaraguans | 96.2 /100 | #112 | Exceptional 20.7% |
| Immigrants | England | 96.2 /100 | #113 | Exceptional 20.7% |
| Burmese | 95.8 /100 | #114 | Exceptional 20.6% |
| French Canadians | 95.0 /100 | #115 | Exceptional 20.6% |
| Italians | 94.9 /100 | #116 | Exceptional 20.6% |
| Croatians | 94.9 /100 | #117 | Exceptional 20.6% |
| Costa Ricans | 94.6 /100 | #118 | Exceptional 20.6% |
| Immigrants | Latin America | 94.5 /100 | #119 | Exceptional 20.5% |
| Maltese | 93.9 /100 | #120 | Exceptional 20.5% |
| Immigrants | Thailand | 93.8 /100 | #121 | Exceptional 20.5% |
| German Russians | 93.7 /100 | #122 | Exceptional 20.5% |
| Immigrants | Korea | 93.7 /100 | #123 | Exceptional 20.5% |
| Central Americans | 93.1 /100 | #124 | Exceptional 20.5% |