Arab vs Ukrainian 3 or more Vehicles in Household
COMPARE
Arab
Ukrainian
3 or more Vehicles in Household
3 or more Vehicles in Household Comparison
Arabs
Ukrainians
18.9%
3 OR MORE VEHICLES IN HOUSEHOLD
17.7/ 100
METRIC RATING
201st/ 347
METRIC RANK
19.6%
3 OR MORE VEHICLES IN HOUSEHOLD
58.9/ 100
METRIC RATING
167th/ 347
METRIC RANK
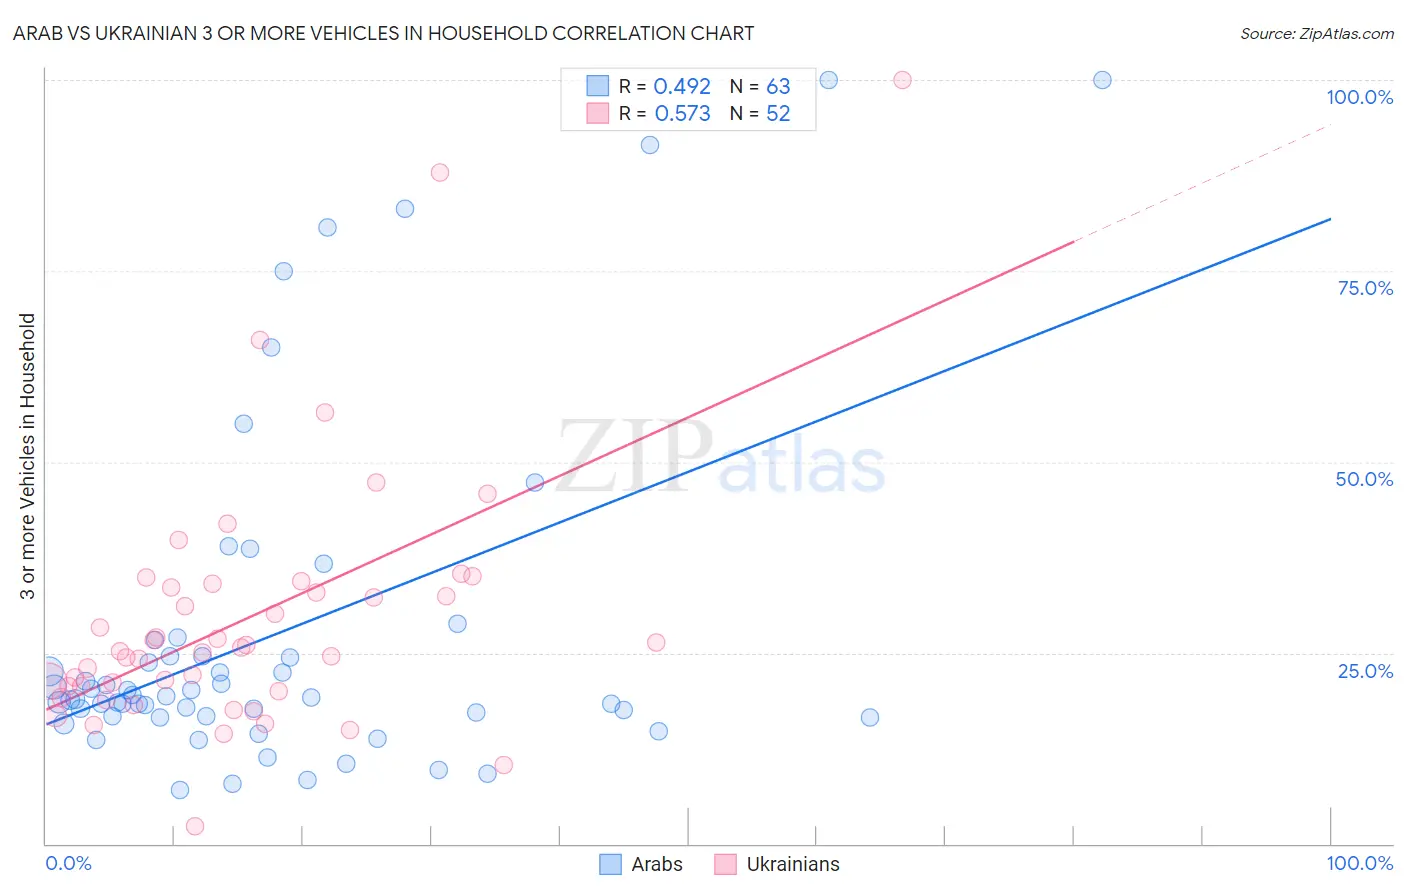
Arab vs Ukrainian 3 or more Vehicles in Household Correlation Chart
The statistical analysis conducted on geographies consisting of 486,191,468 people shows a moderate positive correlation between the proportion of Arabs and percentage of households with 3 or more vehicles available in the United States with a correlation coefficient (R) of 0.492 and weighted average of 18.9%. Similarly, the statistical analysis conducted on geographies consisting of 448,145,260 people shows a substantial positive correlation between the proportion of Ukrainians and percentage of households with 3 or more vehicles available in the United States with a correlation coefficient (R) of 0.573 and weighted average of 19.6%, a difference of 3.7%.
3 or more Vehicles in Household Correlation Summary
| Measurement | Arab | Ukrainian |
| Minimum | 7.1% | 2.3% |
| Maximum | 100.0% | 100.0% |
| Range | 92.9% | 97.7% |
| Mean | 27.5% | 29.5% |
| Median | 19.1% | 25.5% |
| Interquartile 25% (IQ1) | 16.7% | 20.3% |
| Interquartile 75% (IQ3) | 24.6% | 33.8% |
| Interquartile Range (IQR) | 7.9% | 13.5% |
| Standard Deviation (Sample) | 22.5% | 17.1% |
| Standard Deviation (Population) | 22.3% | 17.0% |
Similar Demographics by 3 or more Vehicles in Household
Demographics Similar to Arabs by 3 or more Vehicles in Household
In terms of 3 or more vehicles in household, the demographic groups most similar to Arabs are Argentinean (18.9%, a difference of 0.060%), Immigrants from Norway (19.0%, a difference of 0.16%), Egyptian (19.0%, a difference of 0.22%), Immigrants from Austria (18.9%, a difference of 0.33%), and Tohono O'odham (18.9%, a difference of 0.42%).
| Demographics | Rating | Rank | 3 or more Vehicles in Household |
| Serbians | 24.0 /100 | #194 | Fair 19.1% |
| Immigrants | Moldova | 23.6 /100 | #195 | Fair 19.1% |
| Central American Indians | 22.2 /100 | #196 | Fair 19.0% |
| Immigrants | Japan | 22.0 /100 | #197 | Fair 19.0% |
| Egyptians | 19.5 /100 | #198 | Poor 19.0% |
| Immigrants | Norway | 19.0 /100 | #199 | Poor 19.0% |
| Argentineans | 18.2 /100 | #200 | Poor 18.9% |
| Arabs | 17.7 /100 | #201 | Poor 18.9% |
| Immigrants | Austria | 15.4 /100 | #202 | Poor 18.9% |
| Tohono O'odham | 14.8 /100 | #203 | Poor 18.9% |
| Immigrants | Romania | 14.6 /100 | #204 | Poor 18.9% |
| Russians | 14.2 /100 | #205 | Poor 18.8% |
| Immigrants | Eastern Asia | 14.1 /100 | #206 | Poor 18.8% |
| Immigrants | Chile | 13.6 /100 | #207 | Poor 18.8% |
| Immigrants | Burma/Myanmar | 13.6 /100 | #208 | Poor 18.8% |
Demographics Similar to Ukrainians by 3 or more Vehicles in Household
In terms of 3 or more vehicles in household, the demographic groups most similar to Ukrainians are Peruvian (19.6%, a difference of 0.010%), Immigrants from Denmark (19.6%, a difference of 0.10%), Immigrants from Cameroon (19.7%, a difference of 0.16%), Iraqi (19.6%, a difference of 0.22%), and Immigrants from Costa Rica (19.7%, a difference of 0.24%).
| Demographics | Rating | Rank | 3 or more Vehicles in Household |
| Immigrants | Lebanon | 67.6 /100 | #160 | Good 19.8% |
| Immigrants | Guatemala | 65.6 /100 | #161 | Good 19.7% |
| Estonians | 63.2 /100 | #162 | Good 19.7% |
| Chileans | 63.0 /100 | #163 | Good 19.7% |
| Yugoslavians | 62.9 /100 | #164 | Good 19.7% |
| Immigrants | Costa Rica | 61.9 /100 | #165 | Good 19.7% |
| Immigrants | Cameroon | 60.9 /100 | #166 | Good 19.7% |
| Ukrainians | 58.9 /100 | #167 | Average 19.6% |
| Peruvians | 58.8 /100 | #168 | Average 19.6% |
| Immigrants | Denmark | 57.6 /100 | #169 | Average 19.6% |
| Iraqis | 56.0 /100 | #170 | Average 19.6% |
| Immigrants | Western Europe | 53.2 /100 | #171 | Average 19.5% |
| Kiowa | 50.9 /100 | #172 | Average 19.5% |
| Immigrants | Northern Europe | 50.2 /100 | #173 | Average 19.5% |
| Immigrants | South Africa | 50.0 /100 | #174 | Average 19.5% |