Arab vs Immigrants from Latin America 3 or more Vehicles in Household
COMPARE
Arab
Immigrants from Latin America
3 or more Vehicles in Household
3 or more Vehicles in Household Comparison
Arabs
Immigrants from Latin America
18.9%
3 OR MORE VEHICLES IN HOUSEHOLD
17.7/ 100
METRIC RATING
201st/ 347
METRIC RANK
20.5%
3 OR MORE VEHICLES IN HOUSEHOLD
94.5/ 100
METRIC RATING
119th/ 347
METRIC RANK
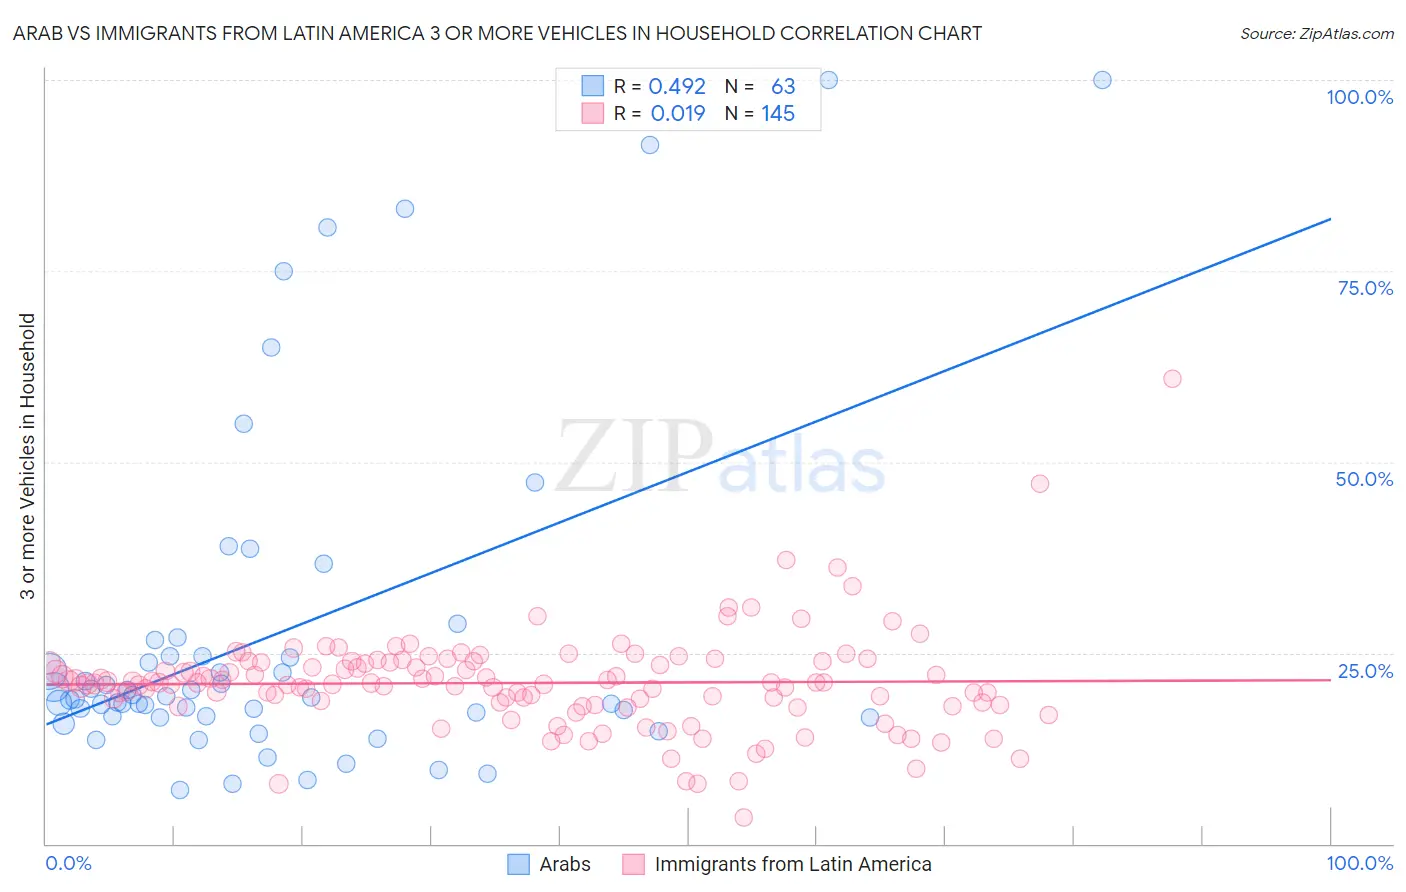
Arab vs Immigrants from Latin America 3 or more Vehicles in Household Correlation Chart
The statistical analysis conducted on geographies consisting of 486,191,468 people shows a moderate positive correlation between the proportion of Arabs and percentage of households with 3 or more vehicles available in the United States with a correlation coefficient (R) of 0.492 and weighted average of 18.9%. Similarly, the statistical analysis conducted on geographies consisting of 557,725,170 people shows no correlation between the proportion of Immigrants from Latin America and percentage of households with 3 or more vehicles available in the United States with a correlation coefficient (R) of 0.019 and weighted average of 20.5%, a difference of 8.5%.
3 or more Vehicles in Household Correlation Summary
| Measurement | Arab | Immigrants from Latin America |
| Minimum | 7.1% | 3.4% |
| Maximum | 100.0% | 60.9% |
| Range | 92.9% | 57.5% |
| Mean | 27.5% | 21.1% |
| Median | 19.1% | 21.0% |
| Interquartile 25% (IQ1) | 16.7% | 18.3% |
| Interquartile 75% (IQ3) | 24.6% | 23.8% |
| Interquartile Range (IQR) | 7.9% | 5.5% |
| Standard Deviation (Sample) | 22.5% | 6.6% |
| Standard Deviation (Population) | 22.3% | 6.6% |
Similar Demographics by 3 or more Vehicles in Household
Demographics Similar to Arabs by 3 or more Vehicles in Household
In terms of 3 or more vehicles in household, the demographic groups most similar to Arabs are Argentinean (18.9%, a difference of 0.060%), Immigrants from Norway (19.0%, a difference of 0.16%), Egyptian (19.0%, a difference of 0.22%), Immigrants from Austria (18.9%, a difference of 0.33%), and Tohono O'odham (18.9%, a difference of 0.42%).
| Demographics | Rating | Rank | 3 or more Vehicles in Household |
| Serbians | 24.0 /100 | #194 | Fair 19.1% |
| Immigrants | Moldova | 23.6 /100 | #195 | Fair 19.1% |
| Central American Indians | 22.2 /100 | #196 | Fair 19.0% |
| Immigrants | Japan | 22.0 /100 | #197 | Fair 19.0% |
| Egyptians | 19.5 /100 | #198 | Poor 19.0% |
| Immigrants | Norway | 19.0 /100 | #199 | Poor 19.0% |
| Argentineans | 18.2 /100 | #200 | Poor 18.9% |
| Arabs | 17.7 /100 | #201 | Poor 18.9% |
| Immigrants | Austria | 15.4 /100 | #202 | Poor 18.9% |
| Tohono O'odham | 14.8 /100 | #203 | Poor 18.9% |
| Immigrants | Romania | 14.6 /100 | #204 | Poor 18.9% |
| Russians | 14.2 /100 | #205 | Poor 18.8% |
| Immigrants | Eastern Asia | 14.1 /100 | #206 | Poor 18.8% |
| Immigrants | Chile | 13.6 /100 | #207 | Poor 18.8% |
| Immigrants | Burma/Myanmar | 13.6 /100 | #208 | Poor 18.8% |
Demographics Similar to Immigrants from Latin America by 3 or more Vehicles in Household
In terms of 3 or more vehicles in household, the demographic groups most similar to Immigrants from Latin America are Costa Rican (20.6%, a difference of 0.040%), Croatian (20.6%, a difference of 0.15%), Italian (20.6%, a difference of 0.17%), Maltese (20.5%, a difference of 0.19%), and French Canadian (20.6%, a difference of 0.20%).
| Demographics | Rating | Rank | 3 or more Vehicles in Household |
| Nicaraguans | 96.2 /100 | #112 | Exceptional 20.7% |
| Immigrants | England | 96.2 /100 | #113 | Exceptional 20.7% |
| Burmese | 95.8 /100 | #114 | Exceptional 20.6% |
| French Canadians | 95.0 /100 | #115 | Exceptional 20.6% |
| Italians | 94.9 /100 | #116 | Exceptional 20.6% |
| Croatians | 94.9 /100 | #117 | Exceptional 20.6% |
| Costa Ricans | 94.6 /100 | #118 | Exceptional 20.6% |
| Immigrants | Latin America | 94.5 /100 | #119 | Exceptional 20.5% |
| Maltese | 93.9 /100 | #120 | Exceptional 20.5% |
| Immigrants | Thailand | 93.8 /100 | #121 | Exceptional 20.5% |
| German Russians | 93.7 /100 | #122 | Exceptional 20.5% |
| Immigrants | Korea | 93.7 /100 | #123 | Exceptional 20.5% |
| Central Americans | 93.1 /100 | #124 | Exceptional 20.5% |
| Immigrants | Netherlands | 92.9 /100 | #125 | Exceptional 20.4% |
| Slavs | 92.1 /100 | #126 | Exceptional 20.4% |