Arab vs Ukrainian Female Poverty
COMPARE
Arab
Ukrainian
Female Poverty
Female Poverty Comparison
Arabs
Ukrainians
13.7%
FEMALE POVERTY
28.6/ 100
METRIC RATING
197th/ 347
METRIC RANK
12.2%
FEMALE POVERTY
98.0/ 100
METRIC RATING
63rd/ 347
METRIC RANK
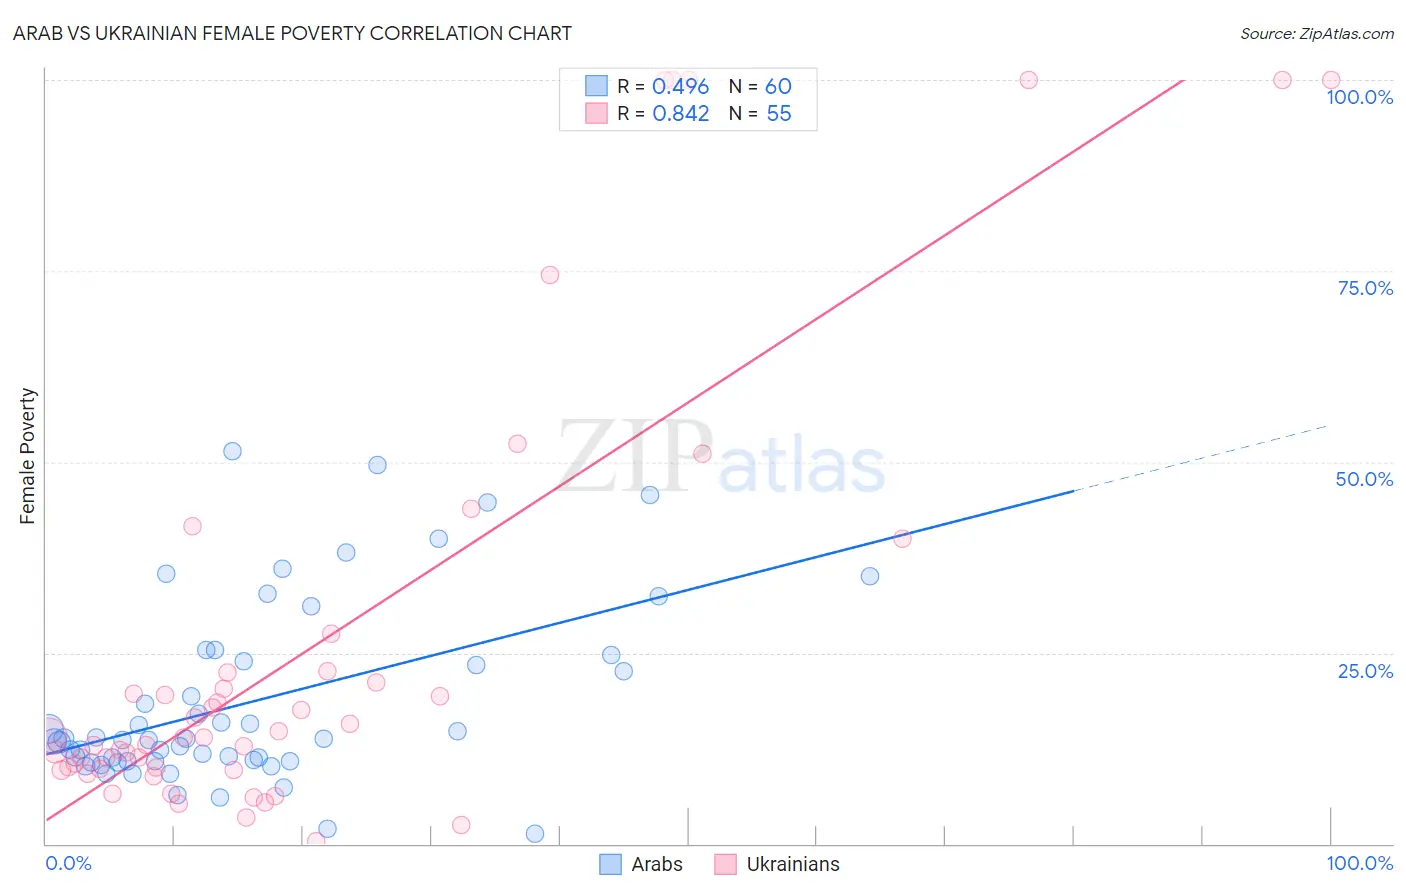
Arab vs Ukrainian Female Poverty Correlation Chart
The statistical analysis conducted on geographies consisting of 486,246,115 people shows a moderate positive correlation between the proportion of Arabs and poverty level among females in the United States with a correlation coefficient (R) of 0.496 and weighted average of 13.7%. Similarly, the statistical analysis conducted on geographies consisting of 448,134,896 people shows a very strong positive correlation between the proportion of Ukrainians and poverty level among females in the United States with a correlation coefficient (R) of 0.842 and weighted average of 12.2%, a difference of 12.7%.
Female Poverty Correlation Summary
| Measurement | Arab | Ukrainian |
| Minimum | 1.3% | 0.40% |
| Maximum | 51.5% | 100.0% |
| Range | 50.2% | 99.6% |
| Mean | 18.5% | 26.3% |
| Median | 13.7% | 13.9% |
| Interquartile 25% (IQ1) | 10.8% | 9.7% |
| Interquartile 75% (IQ3) | 24.3% | 22.6% |
| Interquartile Range (IQR) | 13.5% | 12.8% |
| Standard Deviation (Sample) | 11.9% | 29.3% |
| Standard Deviation (Population) | 11.8% | 29.1% |
Similar Demographics by Female Poverty
Demographics Similar to Arabs by Female Poverty
In terms of female poverty, the demographic groups most similar to Arabs are Immigrants from Uganda (13.7%, a difference of 0.010%), South American Indian (13.7%, a difference of 0.040%), Immigrants from South America (13.7%, a difference of 0.23%), Delaware (13.7%, a difference of 0.29%), and Immigrants from Lebanon (13.8%, a difference of 0.35%).
| Demographics | Rating | Rank | Female Poverty |
| Sierra Leoneans | 33.1 /100 | #190 | Fair 13.7% |
| Immigrants | Kuwait | 32.7 /100 | #191 | Fair 13.7% |
| Immigrants | Costa Rica | 31.9 /100 | #192 | Fair 13.7% |
| Iraqis | 31.8 /100 | #193 | Fair 13.7% |
| Delaware | 31.1 /100 | #194 | Fair 13.7% |
| Immigrants | South America | 30.6 /100 | #195 | Fair 13.7% |
| South American Indians | 28.9 /100 | #196 | Fair 13.7% |
| Arabs | 28.6 /100 | #197 | Fair 13.7% |
| Immigrants | Uganda | 28.5 /100 | #198 | Fair 13.7% |
| Immigrants | Lebanon | 25.6 /100 | #199 | Fair 13.8% |
| Spanish | 21.4 /100 | #200 | Fair 13.9% |
| Immigrants | Kenya | 21.1 /100 | #201 | Fair 13.9% |
| Hmong | 21.1 /100 | #202 | Fair 13.9% |
| Immigrants | Western Asia | 20.7 /100 | #203 | Fair 13.9% |
| Spaniards | 18.9 /100 | #204 | Poor 13.9% |
Demographics Similar to Ukrainians by Female Poverty
In terms of female poverty, the demographic groups most similar to Ukrainians are German (12.2%, a difference of 0.030%), Indian (Asian) (12.2%, a difference of 0.060%), Austrian (12.2%, a difference of 0.070%), Immigrants from Italy (12.2%, a difference of 0.080%), and Immigrants from Asia (12.2%, a difference of 0.10%).
| Demographics | Rating | Rank | Female Poverty |
| Estonians | 98.3 /100 | #56 | Exceptional 12.1% |
| Immigrants | Serbia | 98.3 /100 | #57 | Exceptional 12.1% |
| Scandinavians | 98.2 /100 | #58 | Exceptional 12.1% |
| Immigrants | Europe | 98.2 /100 | #59 | Exceptional 12.1% |
| Immigrants | Australia | 98.1 /100 | #60 | Exceptional 12.2% |
| Immigrants | Asia | 98.1 /100 | #61 | Exceptional 12.2% |
| Immigrants | Italy | 98.0 /100 | #62 | Exceptional 12.2% |
| Ukrainians | 98.0 /100 | #63 | Exceptional 12.2% |
| Germans | 98.0 /100 | #64 | Exceptional 12.2% |
| Indians (Asian) | 97.9 /100 | #65 | Exceptional 12.2% |
| Austrians | 97.9 /100 | #66 | Exceptional 12.2% |
| Immigrants | Eastern Asia | 97.8 /100 | #67 | Exceptional 12.2% |
| Immigrants | Netherlands | 97.8 /100 | #68 | Exceptional 12.2% |
| Swiss | 97.7 /100 | #69 | Exceptional 12.2% |
| Immigrants | Belgium | 97.7 /100 | #70 | Exceptional 12.2% |