Arab vs Ukrainian Householder Income Over 65 years
COMPARE
Arab
Ukrainian
Householder Income Over 65 years
Householder Income Over 65 years Comparison
Arabs
Ukrainians
$62,266
HOUSEHOLDER INCOME OVER 65 YEARS
79.6/ 100
METRIC RATING
140th/ 347
METRIC RANK
$63,032
HOUSEHOLDER INCOME OVER 65 YEARS
89.7/ 100
METRIC RATING
120th/ 347
METRIC RANK
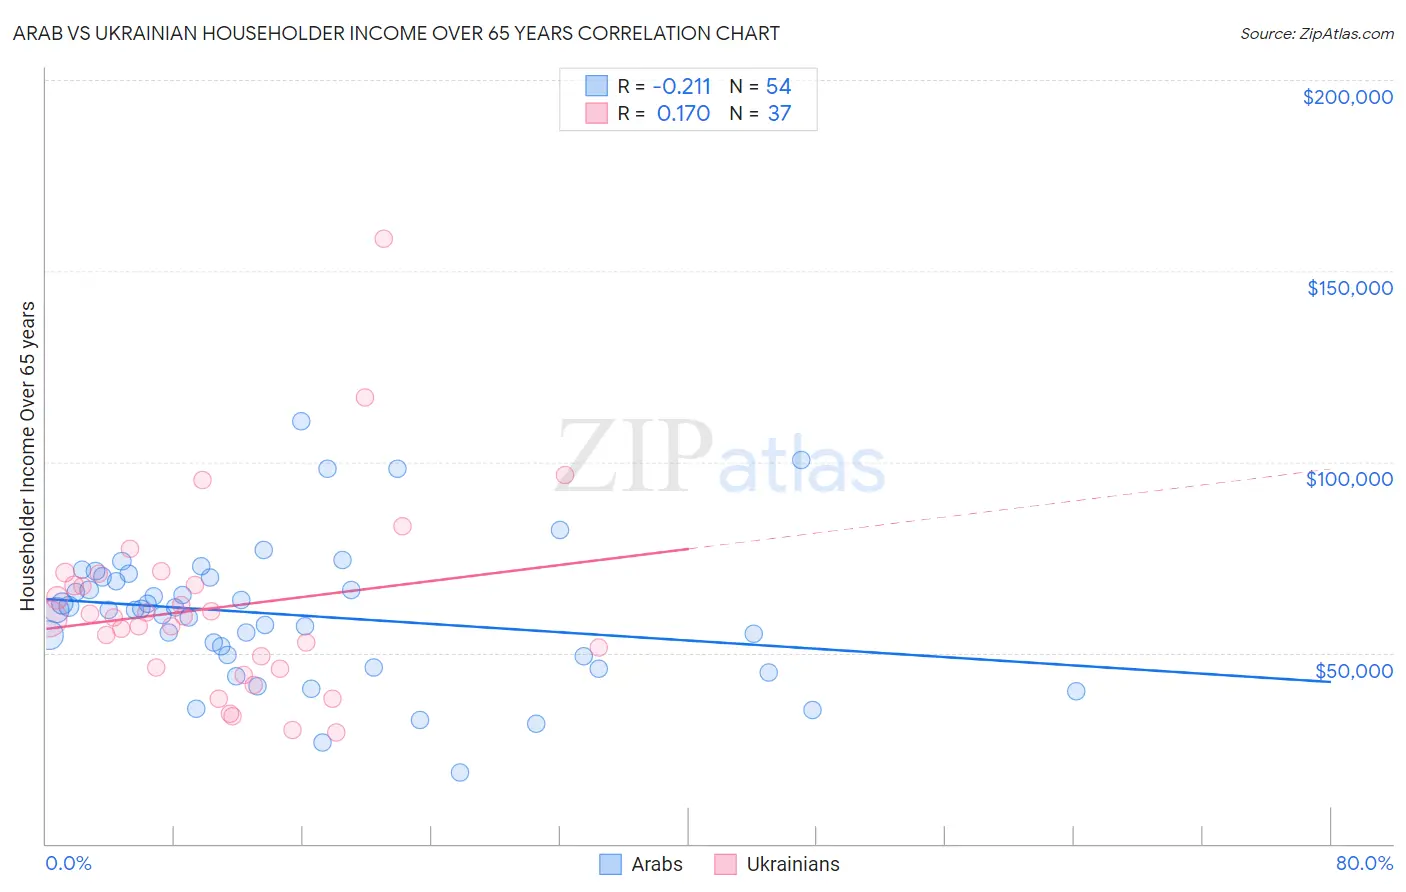
Arab vs Ukrainian Householder Income Over 65 years Correlation Chart
The statistical analysis conducted on geographies consisting of 484,580,257 people shows a weak negative correlation between the proportion of Arabs and household income with householder over the age of 65 in the United States with a correlation coefficient (R) of -0.211 and weighted average of $62,266. Similarly, the statistical analysis conducted on geographies consisting of 446,766,120 people shows a poor positive correlation between the proportion of Ukrainians and household income with householder over the age of 65 in the United States with a correlation coefficient (R) of 0.170 and weighted average of $63,032, a difference of 1.2%.
Householder Income Over 65 years Correlation Summary
| Measurement | Arab | Ukrainian |
| Minimum | $18,625 | $29,107 |
| Maximum | $110,553 | $158,278 |
| Range | $91,928 | $129,171 |
| Mean | $59,915 | $61,843 |
| Median | $61,186 | $59,148 |
| Interquartile 25% (IQ1) | $48,984 | $46,039 |
| Interquartile 75% (IQ3) | $69,644 | $69,195 |
| Interquartile Range (IQR) | $20,660 | $23,156 |
| Standard Deviation (Sample) | $18,146 | $24,881 |
| Standard Deviation (Population) | $17,978 | $24,542 |
Demographics Similar to Arabs and Ukrainians by Householder Income Over 65 years
In terms of householder income over 65 years, the demographic groups most similar to Arabs are Lebanese ($62,287, a difference of 0.030%), Immigrants from Kazakhstan ($62,292, a difference of 0.040%), Immigrants from Syria ($62,303, a difference of 0.060%), Alaskan Athabascan ($62,330, a difference of 0.10%), and Immigrants from Chile ($62,354, a difference of 0.14%). Similarly, the demographic groups most similar to Ukrainians are Immigrants from Vietnam ($63,014, a difference of 0.030%), Immigrants from Moldova ($62,939, a difference of 0.15%), Tlingit-Haida ($62,922, a difference of 0.18%), Taiwanese ($62,894, a difference of 0.22%), and Soviet Union ($62,848, a difference of 0.29%).
| Demographics | Rating | Rank | Householder Income Over 65 years |
| Ukrainians | 89.7 /100 | #120 | Excellent $63,032 |
| Immigrants | Vietnam | 89.5 /100 | #121 | Excellent $63,014 |
| Immigrants | Moldova | 88.7 /100 | #122 | Excellent $62,939 |
| Tlingit-Haida | 88.6 /100 | #123 | Excellent $62,922 |
| Taiwanese | 88.3 /100 | #124 | Excellent $62,894 |
| Soviet Union | 87.8 /100 | #125 | Excellent $62,848 |
| Peruvians | 86.8 /100 | #126 | Excellent $62,766 |
| Swedes | 86.4 /100 | #127 | Excellent $62,736 |
| Aleuts | 86.1 /100 | #128 | Excellent $62,708 |
| Immigrants | Eastern Europe | 85.9 /100 | #129 | Excellent $62,693 |
| Basques | 85.4 /100 | #130 | Excellent $62,653 |
| Immigrants | Western Asia | 85.3 /100 | #131 | Excellent $62,645 |
| Immigrants | Germany | 83.9 /100 | #132 | Excellent $62,544 |
| Immigrants | Northern Africa | 83.6 /100 | #133 | Excellent $62,522 |
| Immigrants | Brazil | 81.2 /100 | #134 | Excellent $62,364 |
| Immigrants | Chile | 81.0 /100 | #135 | Excellent $62,354 |
| Alaskan Athabascans | 80.6 /100 | #136 | Excellent $62,330 |
| Immigrants | Syria | 80.2 /100 | #137 | Excellent $62,303 |
| Immigrants | Kazakhstan | 80.0 /100 | #138 | Excellent $62,292 |
| Lebanese | 79.9 /100 | #139 | Good $62,287 |
| Arabs | 79.6 /100 | #140 | Good $62,266 |