Immigrants from Ghana vs Pima 3 or more Vehicles in Household
COMPARE
Immigrants from Ghana
Pima
3 or more Vehicles in Household
3 or more Vehicles in Household Comparison
Immigrants from Ghana
Pima
16.2%
3 OR MORE VEHICLES IN HOUSEHOLD
0.0/ 100
METRIC RATING
307th/ 347
METRIC RANK
22.0%
3 OR MORE VEHICLES IN HOUSEHOLD
99.9/ 100
METRIC RATING
65th/ 347
METRIC RANK
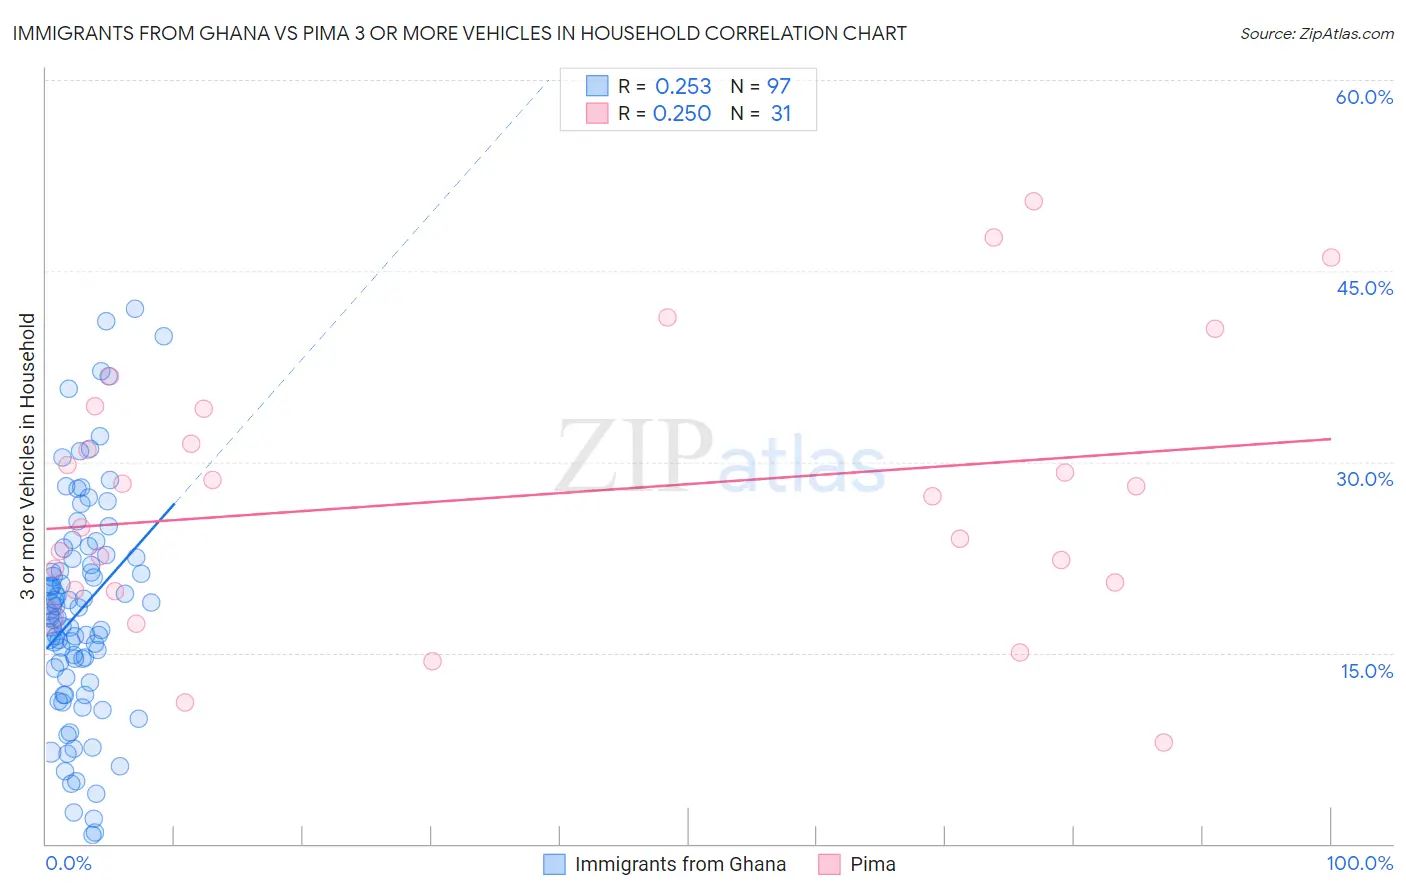
Immigrants from Ghana vs Pima 3 or more Vehicles in Household Correlation Chart
The statistical analysis conducted on geographies consisting of 199,771,460 people shows a weak positive correlation between the proportion of Immigrants from Ghana and percentage of households with 3 or more vehicles available in the United States with a correlation coefficient (R) of 0.253 and weighted average of 16.2%. Similarly, the statistical analysis conducted on geographies consisting of 61,538,722 people shows a weak positive correlation between the proportion of Pima and percentage of households with 3 or more vehicles available in the United States with a correlation coefficient (R) of 0.250 and weighted average of 22.0%, a difference of 36.4%.
3 or more Vehicles in Household Correlation Summary
| Measurement | Immigrants from Ghana | Pima |
| Minimum | 0.70% | 8.0% |
| Maximum | 42.0% | 50.5% |
| Range | 41.3% | 42.6% |
| Mean | 18.3% | 27.3% |
| Median | 17.8% | 27.3% |
| Interquartile 25% (IQ1) | 12.9% | 20.0% |
| Interquartile 75% (IQ3) | 22.6% | 34.1% |
| Interquartile Range (IQR) | 9.7% | 14.2% |
| Standard Deviation (Sample) | 8.8% | 10.5% |
| Standard Deviation (Population) | 8.8% | 10.3% |
Similar Demographics by 3 or more Vehicles in Household
Demographics Similar to Immigrants from Ghana by 3 or more Vehicles in Household
In terms of 3 or more vehicles in household, the demographic groups most similar to Immigrants from Ghana are Somali (16.2%, a difference of 0.15%), Houma (16.1%, a difference of 0.59%), Immigrants from Morocco (16.3%, a difference of 0.96%), Ghanaian (16.4%, a difference of 1.2%), and Immigrants from Somalia (15.9%, a difference of 1.5%).
| Demographics | Rating | Rank | 3 or more Vehicles in Household |
| Cypriots | 0.0 /100 | #300 | Tragic 16.6% |
| Paraguayans | 0.0 /100 | #301 | Tragic 16.6% |
| Immigrants | Greece | 0.0 /100 | #302 | Tragic 16.5% |
| Immigrants | Serbia | 0.0 /100 | #303 | Tragic 16.4% |
| Ghanaians | 0.0 /100 | #304 | Tragic 16.4% |
| Immigrants | Morocco | 0.0 /100 | #305 | Tragic 16.3% |
| Somalis | 0.0 /100 | #306 | Tragic 16.2% |
| Immigrants | Ghana | 0.0 /100 | #307 | Tragic 16.2% |
| Houma | 0.0 /100 | #308 | Tragic 16.1% |
| Immigrants | Somalia | 0.0 /100 | #309 | Tragic 15.9% |
| Moroccans | 0.0 /100 | #310 | Tragic 15.9% |
| Albanians | 0.0 /100 | #311 | Tragic 15.8% |
| Puerto Ricans | 0.0 /100 | #312 | Tragic 15.6% |
| Immigrants | Israel | 0.0 /100 | #313 | Tragic 15.6% |
| Immigrants | Belarus | 0.0 /100 | #314 | Tragic 15.5% |
Demographics Similar to Pima by 3 or more Vehicles in Household
In terms of 3 or more vehicles in household, the demographic groups most similar to Pima are Northern European (22.0%, a difference of 0.14%), Alaskan Athabascan (21.9%, a difference of 0.40%), Immigrants from Taiwan (22.1%, a difference of 0.42%), British (21.9%, a difference of 0.55%), and Creek (21.9%, a difference of 0.58%).
| Demographics | Rating | Rank | 3 or more Vehicles in Household |
| Spaniards | 100.0 /100 | #58 | Exceptional 22.3% |
| Navajo | 100.0 /100 | #59 | Exceptional 22.3% |
| Finns | 99.9 /100 | #60 | Exceptional 22.3% |
| Bhutanese | 99.9 /100 | #61 | Exceptional 22.2% |
| Fijians | 99.9 /100 | #62 | Exceptional 22.2% |
| Chickasaw | 99.9 /100 | #63 | Exceptional 22.2% |
| Immigrants | Taiwan | 99.9 /100 | #64 | Exceptional 22.1% |
| Pima | 99.9 /100 | #65 | Exceptional 22.0% |
| Northern Europeans | 99.9 /100 | #66 | Exceptional 22.0% |
| Alaskan Athabascans | 99.9 /100 | #67 | Exceptional 21.9% |
| British | 99.9 /100 | #68 | Exceptional 21.9% |
| Creek | 99.9 /100 | #69 | Exceptional 21.9% |
| Bangladeshis | 99.8 /100 | #70 | Exceptional 21.9% |
| Potawatomi | 99.8 /100 | #71 | Exceptional 21.9% |
| Portuguese | 99.8 /100 | #72 | Exceptional 21.8% |