Immigrants from Yemen vs Kiowa 3 or more Vehicles in Household
COMPARE
Immigrants from Yemen
Kiowa
3 or more Vehicles in Household
3 or more Vehicles in Household Comparison
Immigrants from Yemen
Kiowa
14.2%
3 OR MORE VEHICLES IN HOUSEHOLD
0.0/ 100
METRIC RATING
324th/ 347
METRIC RANK
19.5%
3 OR MORE VEHICLES IN HOUSEHOLD
50.9/ 100
METRIC RATING
172nd/ 347
METRIC RANK
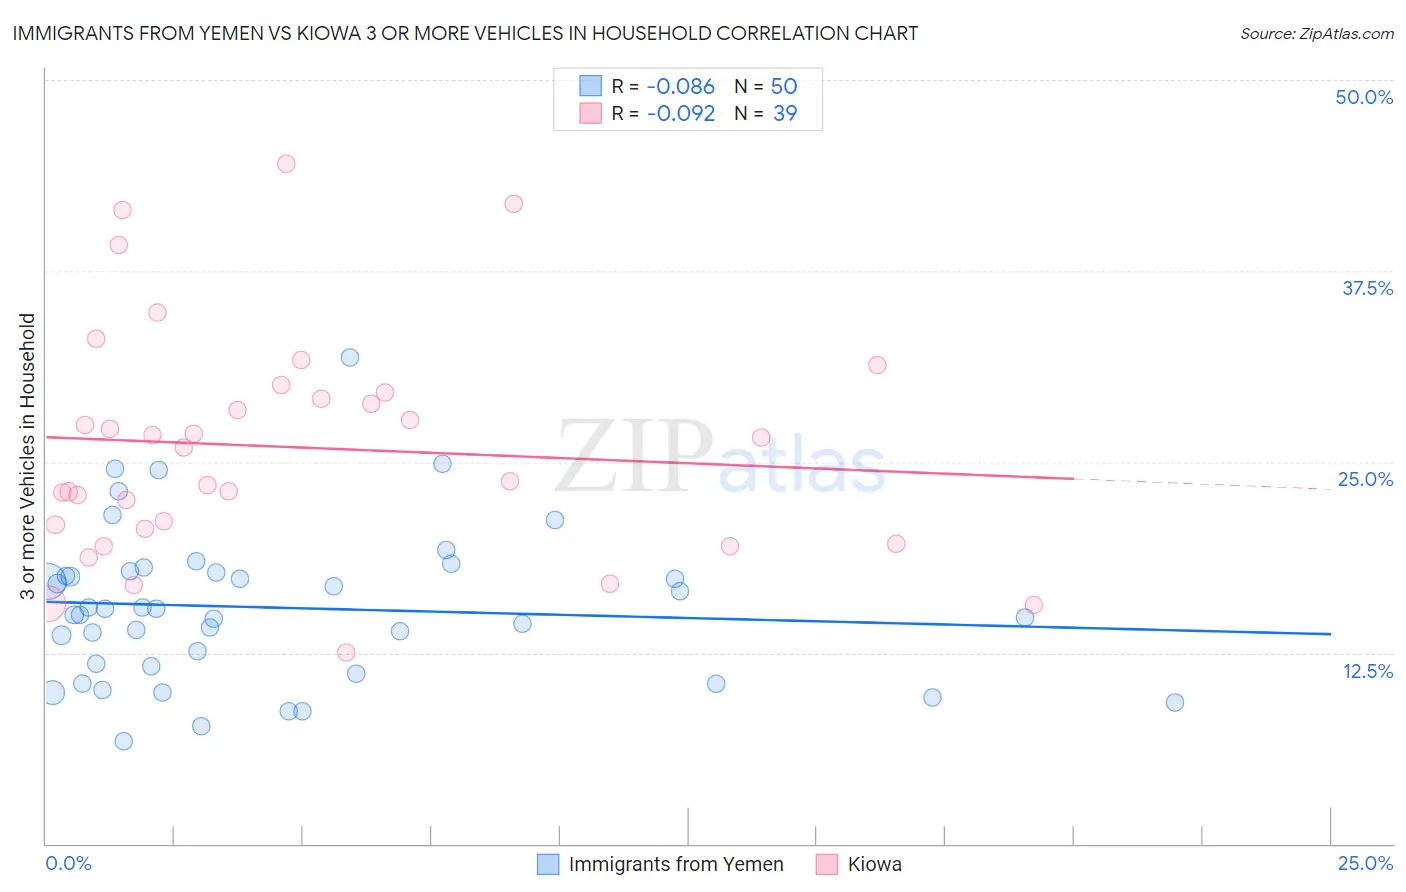
Immigrants from Yemen vs Kiowa 3 or more Vehicles in Household Correlation Chart
The statistical analysis conducted on geographies consisting of 82,431,124 people shows a slight negative correlation between the proportion of Immigrants from Yemen and percentage of households with 3 or more vehicles available in the United States with a correlation coefficient (R) of -0.086 and weighted average of 14.2%. Similarly, the statistical analysis conducted on geographies consisting of 56,098,357 people shows a slight negative correlation between the proportion of Kiowa and percentage of households with 3 or more vehicles available in the United States with a correlation coefficient (R) of -0.092 and weighted average of 19.5%, a difference of 37.0%.
3 or more Vehicles in Household Correlation Summary
| Measurement | Immigrants from Yemen | Kiowa |
| Minimum | 6.7% | 12.5% |
| Maximum | 31.8% | 44.5% |
| Range | 25.1% | 32.0% |
| Mean | 15.5% | 25.9% |
| Median | 15.2% | 26.0% |
| Interquartile 25% (IQ1) | 11.6% | 20.6% |
| Interquartile 75% (IQ3) | 17.8% | 29.5% |
| Interquartile Range (IQR) | 6.1% | 8.9% |
| Standard Deviation (Sample) | 5.0% | 7.5% |
| Standard Deviation (Population) | 5.0% | 7.4% |
Similar Demographics by 3 or more Vehicles in Household
Demographics Similar to Immigrants from Yemen by 3 or more Vehicles in Household
In terms of 3 or more vehicles in household, the demographic groups most similar to Immigrants from Yemen are Senegalese (14.2%, a difference of 0.080%), Soviet Union (14.2%, a difference of 0.41%), Ecuadorian (14.1%, a difference of 1.3%), Immigrants from Albania (14.0%, a difference of 2.0%), and Immigrants from Caribbean (14.6%, a difference of 2.3%).
| Demographics | Rating | Rank | 3 or more Vehicles in Household |
| Jamaicans | 0.0 /100 | #317 | Tragic 15.2% |
| Immigrants | Haiti | 0.0 /100 | #318 | Tragic 15.2% |
| Cape Verdeans | 0.0 /100 | #319 | Tragic 15.0% |
| Yup'ik | 0.0 /100 | #320 | Tragic 14.8% |
| Immigrants | Jamaica | 0.0 /100 | #321 | Tragic 14.7% |
| Immigrants | West Indies | 0.0 /100 | #322 | Tragic 14.6% |
| Immigrants | Caribbean | 0.0 /100 | #323 | Tragic 14.6% |
| Immigrants | Yemen | 0.0 /100 | #324 | Tragic 14.2% |
| Senegalese | 0.0 /100 | #325 | Tragic 14.2% |
| Soviet Union | 0.0 /100 | #326 | Tragic 14.2% |
| Ecuadorians | 0.0 /100 | #327 | Tragic 14.1% |
| Immigrants | Albania | 0.0 /100 | #328 | Tragic 14.0% |
| Immigrants | Senegal | 0.0 /100 | #329 | Tragic 13.8% |
| West Indians | 0.0 /100 | #330 | Tragic 13.7% |
| Immigrants | Dominica | 0.0 /100 | #331 | Tragic 13.7% |
Demographics Similar to Kiowa by 3 or more Vehicles in Household
In terms of 3 or more vehicles in household, the demographic groups most similar to Kiowa are Immigrants from Northern Europe (19.5%, a difference of 0.050%), Immigrants from South Africa (19.5%, a difference of 0.070%), Immigrants from Western Europe (19.5%, a difference of 0.18%), Syrian (19.5%, a difference of 0.30%), and Iroquois (19.4%, a difference of 0.37%).
| Demographics | Rating | Rank | 3 or more Vehicles in Household |
| Immigrants | Costa Rica | 61.9 /100 | #165 | Good 19.7% |
| Immigrants | Cameroon | 60.9 /100 | #166 | Good 19.7% |
| Ukrainians | 58.9 /100 | #167 | Average 19.6% |
| Peruvians | 58.8 /100 | #168 | Average 19.6% |
| Immigrants | Denmark | 57.6 /100 | #169 | Average 19.6% |
| Iraqis | 56.0 /100 | #170 | Average 19.6% |
| Immigrants | Western Europe | 53.2 /100 | #171 | Average 19.5% |
| Kiowa | 50.9 /100 | #172 | Average 19.5% |
| Immigrants | Northern Europe | 50.2 /100 | #173 | Average 19.5% |
| Immigrants | South Africa | 50.0 /100 | #174 | Average 19.5% |
| Syrians | 47.0 /100 | #175 | Average 19.5% |
| Iroquois | 46.0 /100 | #176 | Average 19.4% |
| Immigrants | Peru | 41.1 /100 | #177 | Average 19.4% |
| Immigrants | Syria | 40.3 /100 | #178 | Average 19.4% |
| Immigrants | South Central Asia | 38.9 /100 | #179 | Fair 19.3% |