Choctaw vs Immigrants from Australia 3 or more Vehicles in Household
COMPARE
Choctaw
Immigrants from Australia
3 or more Vehicles in Household
3 or more Vehicles in Household Comparison
Choctaw
Immigrants from Australia
23.0%
3 OR MORE VEHICLES IN HOUSEHOLD
100.0/ 100
METRIC RATING
35th/ 347
METRIC RANK
18.1%
3 OR MORE VEHICLES IN HOUSEHOLD
2.0/ 100
METRIC RATING
246th/ 347
METRIC RANK
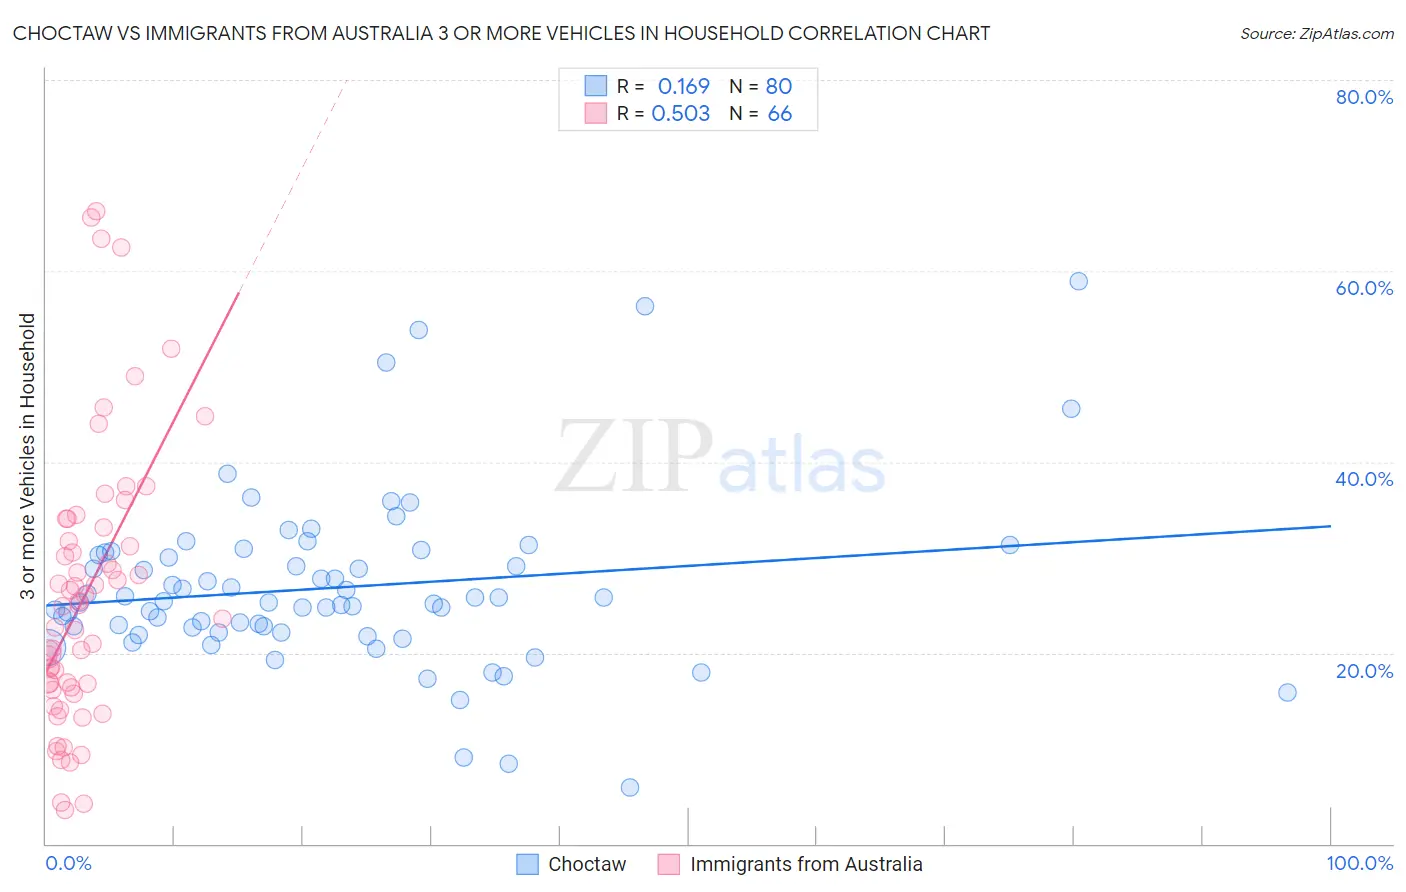
Choctaw vs Immigrants from Australia 3 or more Vehicles in Household Correlation Chart
The statistical analysis conducted on geographies consisting of 269,608,745 people shows a poor positive correlation between the proportion of Choctaw and percentage of households with 3 or more vehicles available in the United States with a correlation coefficient (R) of 0.169 and weighted average of 23.0%. Similarly, the statistical analysis conducted on geographies consisting of 227,053,605 people shows a substantial positive correlation between the proportion of Immigrants from Australia and percentage of households with 3 or more vehicles available in the United States with a correlation coefficient (R) of 0.503 and weighted average of 18.1%, a difference of 27.3%.
3 or more Vehicles in Household Correlation Summary
| Measurement | Choctaw | Immigrants from Australia |
| Minimum | 5.9% | 3.6% |
| Maximum | 58.9% | 66.2% |
| Range | 53.0% | 62.7% |
| Mean | 26.8% | 26.2% |
| Median | 25.3% | 24.9% |
| Interquartile 25% (IQ1) | 22.4% | 16.4% |
| Interquartile 75% (IQ3) | 30.4% | 33.1% |
| Interquartile Range (IQR) | 7.9% | 16.7% |
| Standard Deviation (Sample) | 9.1% | 14.6% |
| Standard Deviation (Population) | 9.0% | 14.5% |
Similar Demographics by 3 or more Vehicles in Household
Demographics Similar to Choctaw by 3 or more Vehicles in Household
In terms of 3 or more vehicles in household, the demographic groups most similar to Choctaw are Swiss (23.0%, a difference of 0.020%), Cherokee (23.0%, a difference of 0.040%), Spanish American (23.0%, a difference of 0.070%), Swedish (23.0%, a difference of 0.070%), and Pueblo (23.0%, a difference of 0.13%).
| Demographics | Rating | Rank | 3 or more Vehicles in Household |
| Lumbee | 100.0 /100 | #28 | Exceptional 23.1% |
| Spanish | 100.0 /100 | #29 | Exceptional 23.1% |
| Immigrants | South Eastern Asia | 100.0 /100 | #30 | Exceptional 23.1% |
| English | 100.0 /100 | #31 | Exceptional 23.1% |
| Pueblo | 100.0 /100 | #32 | Exceptional 23.0% |
| Spanish Americans | 100.0 /100 | #33 | Exceptional 23.0% |
| Swiss | 100.0 /100 | #34 | Exceptional 23.0% |
| Choctaw | 100.0 /100 | #35 | Exceptional 23.0% |
| Cherokee | 100.0 /100 | #36 | Exceptional 23.0% |
| Swedes | 100.0 /100 | #37 | Exceptional 23.0% |
| Dutch | 100.0 /100 | #38 | Exceptional 22.9% |
| Yaqui | 100.0 /100 | #39 | Exceptional 22.9% |
| Europeans | 100.0 /100 | #40 | Exceptional 22.9% |
| Germans | 100.0 /100 | #41 | Exceptional 22.7% |
| Natives/Alaskans | 100.0 /100 | #42 | Exceptional 22.7% |
Demographics Similar to Immigrants from Australia by 3 or more Vehicles in Household
In terms of 3 or more vehicles in household, the demographic groups most similar to Immigrants from Australia are Immigrants from Belize (18.1%, a difference of 0.070%), Carpatho Rusyn (18.0%, a difference of 0.16%), Mongolian (18.1%, a difference of 0.23%), Immigrants from Eastern Africa (18.0%, a difference of 0.29%), and Immigrants from Europe (18.1%, a difference of 0.35%).
| Demographics | Rating | Rank | 3 or more Vehicles in Household |
| Immigrants | Middle Africa | 3.1 /100 | #239 | Tragic 18.2% |
| Immigrants | China | 2.9 /100 | #240 | Tragic 18.2% |
| Africans | 2.7 /100 | #241 | Tragic 18.2% |
| Hopi | 2.5 /100 | #242 | Tragic 18.2% |
| Immigrants | Europe | 2.4 /100 | #243 | Tragic 18.1% |
| Mongolians | 2.3 /100 | #244 | Tragic 18.1% |
| Immigrants | Belize | 2.1 /100 | #245 | Tragic 18.1% |
| Immigrants | Australia | 2.0 /100 | #246 | Tragic 18.1% |
| Carpatho Rusyns | 1.9 /100 | #247 | Tragic 18.0% |
| Immigrants | Eastern Africa | 1.8 /100 | #248 | Tragic 18.0% |
| Immigrants | Saudi Arabia | 1.7 /100 | #249 | Tragic 18.0% |
| Venezuelans | 1.7 /100 | #250 | Tragic 18.0% |
| Alsatians | 1.5 /100 | #251 | Tragic 18.0% |
| Immigrants | Southern Europe | 1.4 /100 | #252 | Tragic 17.9% |
| Immigrants | Ethiopia | 1.3 /100 | #253 | Tragic 17.9% |