Alaska Native vs Immigrants from Australia Doctorate Degree
COMPARE
Alaska Native
Immigrants from Australia
Doctorate Degree
Doctorate Degree Comparison
Alaska Natives
Immigrants from Australia
1.4%
DOCTORATE DEGREE
0.3/ 100
METRIC RATING
292nd/ 347
METRIC RANK
2.8%
DOCTORATE DEGREE
100.0/ 100
METRIC RATING
17th/ 347
METRIC RANK
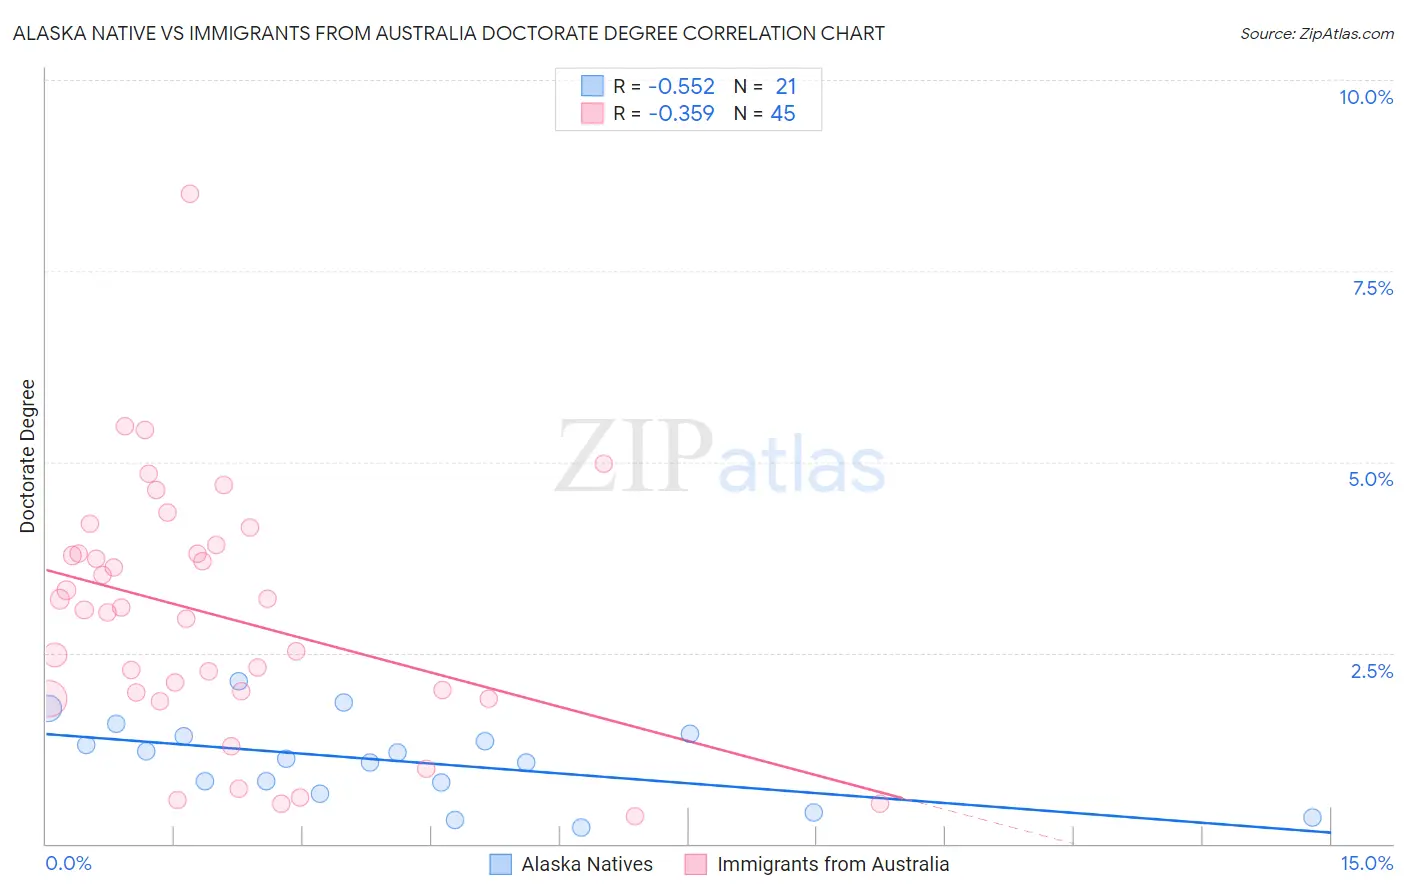
Alaska Native vs Immigrants from Australia Doctorate Degree Correlation Chart
The statistical analysis conducted on geographies consisting of 76,370,977 people shows a substantial negative correlation between the proportion of Alaska Natives and percentage of population with at least doctorate degree education in the United States with a correlation coefficient (R) of -0.552 and weighted average of 1.4%. Similarly, the statistical analysis conducted on geographies consisting of 226,352,894 people shows a mild negative correlation between the proportion of Immigrants from Australia and percentage of population with at least doctorate degree education in the United States with a correlation coefficient (R) of -0.359 and weighted average of 2.8%, a difference of 94.5%.
Doctorate Degree Correlation Summary
| Measurement | Alaska Native | Immigrants from Australia |
| Minimum | 0.21% | 0.36% |
| Maximum | 2.1% | 8.5% |
| Range | 1.9% | 8.2% |
| Mean | 1.1% | 3.0% |
| Median | 1.1% | 3.1% |
| Interquartile 25% (IQ1) | 0.73% | 1.9% |
| Interquartile 75% (IQ3) | 1.4% | 3.9% |
| Interquartile Range (IQR) | 0.69% | 1.9% |
| Standard Deviation (Sample) | 0.53% | 1.6% |
| Standard Deviation (Population) | 0.51% | 1.6% |
Similar Demographics by Doctorate Degree
Demographics Similar to Alaska Natives by Doctorate Degree
In terms of doctorate degree, the demographic groups most similar to Alaska Natives are Black/African American (1.4%, a difference of 0.17%), Choctaw (1.4%, a difference of 0.40%), Cape Verdean (1.4%, a difference of 0.42%), Immigrants from El Salvador (1.4%, a difference of 0.55%), and Immigrants from Yemen (1.4%, a difference of 0.59%).
| Demographics | Rating | Rank | Doctorate Degree |
| Malaysians | 0.3 /100 | #285 | Tragic 1.5% |
| Cherokee | 0.3 /100 | #286 | Tragic 1.5% |
| Cajuns | 0.3 /100 | #287 | Tragic 1.5% |
| Immigrants | El Salvador | 0.3 /100 | #288 | Tragic 1.4% |
| Cape Verdeans | 0.3 /100 | #289 | Tragic 1.4% |
| Choctaw | 0.3 /100 | #290 | Tragic 1.4% |
| Blacks/African Americans | 0.3 /100 | #291 | Tragic 1.4% |
| Alaska Natives | 0.3 /100 | #292 | Tragic 1.4% |
| Immigrants | Yemen | 0.2 /100 | #293 | Tragic 1.4% |
| Samoans | 0.2 /100 | #294 | Tragic 1.4% |
| Guatemalans | 0.2 /100 | #295 | Tragic 1.4% |
| Immigrants | Ecuador | 0.2 /100 | #296 | Tragic 1.4% |
| Tsimshian | 0.2 /100 | #297 | Tragic 1.4% |
| Puerto Ricans | 0.1 /100 | #298 | Tragic 1.4% |
| Belizeans | 0.1 /100 | #299 | Tragic 1.4% |
Demographics Similar to Immigrants from Australia by Doctorate Degree
In terms of doctorate degree, the demographic groups most similar to Immigrants from Australia are Immigrants from Sri Lanka (2.8%, a difference of 0.24%), Immigrants from Japan (2.8%, a difference of 0.62%), Eastern European (2.8%, a difference of 0.70%), Immigrants from Hong Kong (2.8%, a difference of 0.97%), and Immigrants from India (2.8%, a difference of 1.0%).
| Demographics | Rating | Rank | Doctorate Degree |
| Immigrants | Eastern Asia | 100.0 /100 | #10 | Exceptional 3.0% |
| Indians (Asian) | 100.0 /100 | #11 | Exceptional 2.9% |
| Immigrants | Belgium | 100.0 /100 | #12 | Exceptional 2.9% |
| Immigrants | Sweden | 100.0 /100 | #13 | Exceptional 2.9% |
| Immigrants | France | 100.0 /100 | #14 | Exceptional 2.9% |
| Immigrants | India | 100.0 /100 | #15 | Exceptional 2.8% |
| Eastern Europeans | 100.0 /100 | #16 | Exceptional 2.8% |
| Immigrants | Australia | 100.0 /100 | #17 | Exceptional 2.8% |
| Immigrants | Sri Lanka | 100.0 /100 | #18 | Exceptional 2.8% |
| Immigrants | Japan | 100.0 /100 | #19 | Exceptional 2.8% |
| Immigrants | Hong Kong | 100.0 /100 | #20 | Exceptional 2.8% |
| Thais | 100.0 /100 | #21 | Exceptional 2.8% |
| Mongolians | 100.0 /100 | #22 | Exceptional 2.8% |
| Immigrants | Denmark | 100.0 /100 | #23 | Exceptional 2.8% |
| Israelis | 100.0 /100 | #24 | Exceptional 2.7% |