Italian vs Immigrants from Australia 3 or more Vehicles in Household
COMPARE
Italian
Immigrants from Australia
3 or more Vehicles in Household
3 or more Vehicles in Household Comparison
Italians
Immigrants from Australia
20.6%
3 OR MORE VEHICLES IN HOUSEHOLD
94.9/ 100
METRIC RATING
116th/ 347
METRIC RANK
18.1%
3 OR MORE VEHICLES IN HOUSEHOLD
2.0/ 100
METRIC RATING
246th/ 347
METRIC RANK
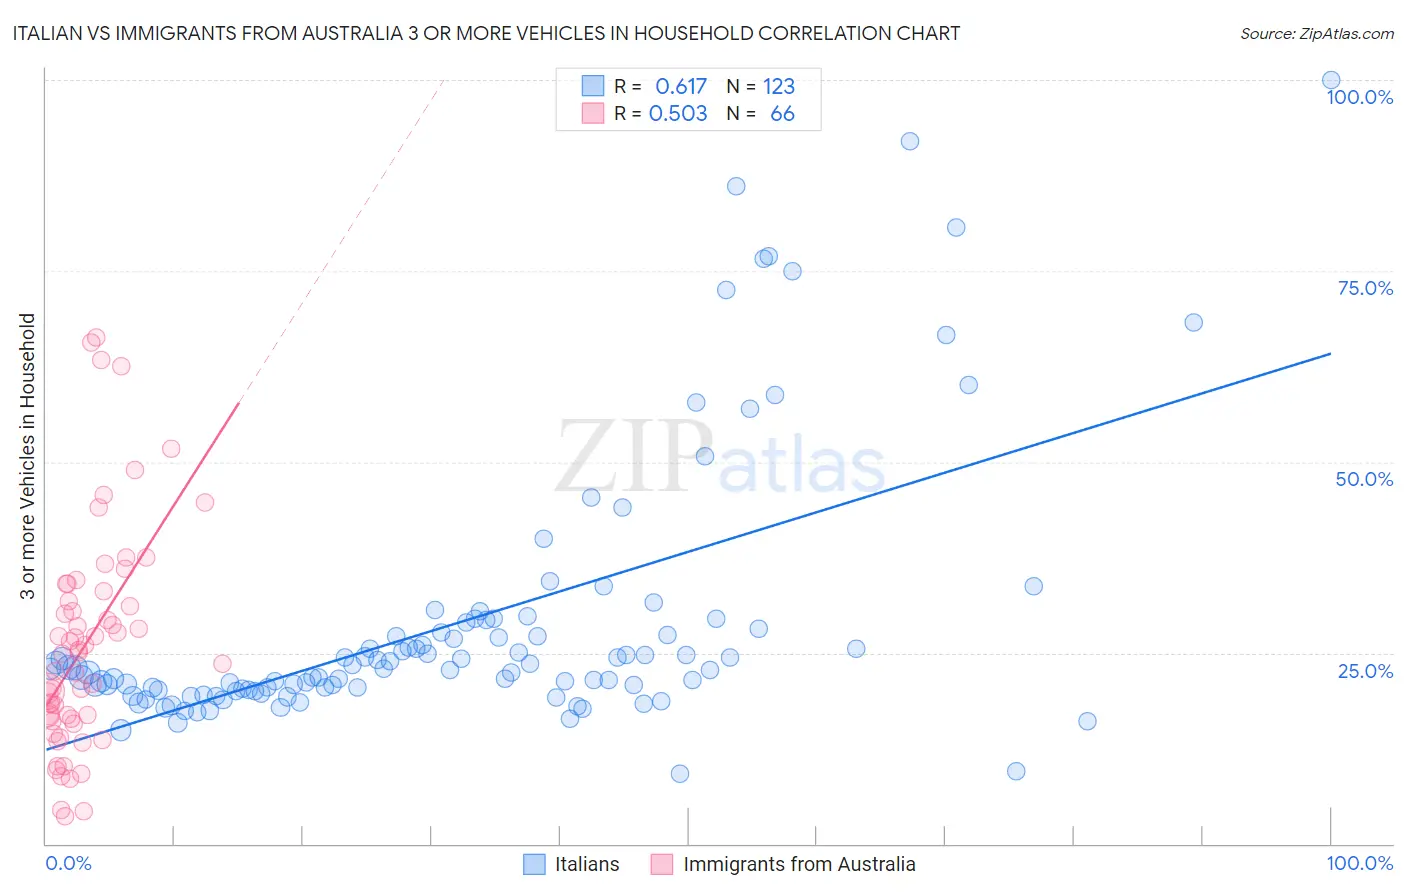
Italian vs Immigrants from Australia 3 or more Vehicles in Household Correlation Chart
The statistical analysis conducted on geographies consisting of 574,109,348 people shows a significant positive correlation between the proportion of Italians and percentage of households with 3 or more vehicles available in the United States with a correlation coefficient (R) of 0.617 and weighted average of 20.6%. Similarly, the statistical analysis conducted on geographies consisting of 227,053,605 people shows a substantial positive correlation between the proportion of Immigrants from Australia and percentage of households with 3 or more vehicles available in the United States with a correlation coefficient (R) of 0.503 and weighted average of 18.1%, a difference of 13.9%.
3 or more Vehicles in Household Correlation Summary
| Measurement | Italian | Immigrants from Australia |
| Minimum | 9.2% | 3.6% |
| Maximum | 100.0% | 66.2% |
| Range | 90.8% | 62.7% |
| Mean | 29.1% | 26.2% |
| Median | 23.0% | 24.9% |
| Interquartile 25% (IQ1) | 20.2% | 16.4% |
| Interquartile 75% (IQ3) | 28.2% | 33.1% |
| Interquartile Range (IQR) | 8.1% | 16.7% |
| Standard Deviation (Sample) | 17.5% | 14.6% |
| Standard Deviation (Population) | 17.5% | 14.5% |
Similar Demographics by 3 or more Vehicles in Household
Demographics Similar to Italians by 3 or more Vehicles in Household
In terms of 3 or more vehicles in household, the demographic groups most similar to Italians are Croatian (20.6%, a difference of 0.020%), French Canadian (20.6%, a difference of 0.030%), Costa Rican (20.6%, a difference of 0.13%), Immigrants from Latin America (20.5%, a difference of 0.17%), and Burmese (20.6%, a difference of 0.34%).
| Demographics | Rating | Rank | 3 or more Vehicles in Household |
| Filipinos | 97.0 /100 | #109 | Exceptional 20.8% |
| Asians | 96.8 /100 | #110 | Exceptional 20.8% |
| Immigrants | Micronesia | 96.7 /100 | #111 | Exceptional 20.7% |
| Nicaraguans | 96.2 /100 | #112 | Exceptional 20.7% |
| Immigrants | England | 96.2 /100 | #113 | Exceptional 20.7% |
| Burmese | 95.8 /100 | #114 | Exceptional 20.6% |
| French Canadians | 95.0 /100 | #115 | Exceptional 20.6% |
| Italians | 94.9 /100 | #116 | Exceptional 20.6% |
| Croatians | 94.9 /100 | #117 | Exceptional 20.6% |
| Costa Ricans | 94.6 /100 | #118 | Exceptional 20.6% |
| Immigrants | Latin America | 94.5 /100 | #119 | Exceptional 20.5% |
| Maltese | 93.9 /100 | #120 | Exceptional 20.5% |
| Immigrants | Thailand | 93.8 /100 | #121 | Exceptional 20.5% |
| German Russians | 93.7 /100 | #122 | Exceptional 20.5% |
| Immigrants | Korea | 93.7 /100 | #123 | Exceptional 20.5% |
Demographics Similar to Immigrants from Australia by 3 or more Vehicles in Household
In terms of 3 or more vehicles in household, the demographic groups most similar to Immigrants from Australia are Immigrants from Belize (18.1%, a difference of 0.070%), Carpatho Rusyn (18.0%, a difference of 0.16%), Mongolian (18.1%, a difference of 0.23%), Immigrants from Eastern Africa (18.0%, a difference of 0.29%), and Immigrants from Europe (18.1%, a difference of 0.35%).
| Demographics | Rating | Rank | 3 or more Vehicles in Household |
| Immigrants | Middle Africa | 3.1 /100 | #239 | Tragic 18.2% |
| Immigrants | China | 2.9 /100 | #240 | Tragic 18.2% |
| Africans | 2.7 /100 | #241 | Tragic 18.2% |
| Hopi | 2.5 /100 | #242 | Tragic 18.2% |
| Immigrants | Europe | 2.4 /100 | #243 | Tragic 18.1% |
| Mongolians | 2.3 /100 | #244 | Tragic 18.1% |
| Immigrants | Belize | 2.1 /100 | #245 | Tragic 18.1% |
| Immigrants | Australia | 2.0 /100 | #246 | Tragic 18.1% |
| Carpatho Rusyns | 1.9 /100 | #247 | Tragic 18.0% |
| Immigrants | Eastern Africa | 1.8 /100 | #248 | Tragic 18.0% |
| Immigrants | Saudi Arabia | 1.7 /100 | #249 | Tragic 18.0% |
| Venezuelans | 1.7 /100 | #250 | Tragic 18.0% |
| Alsatians | 1.5 /100 | #251 | Tragic 18.0% |
| Immigrants | Southern Europe | 1.4 /100 | #252 | Tragic 17.9% |
| Immigrants | Ethiopia | 1.3 /100 | #253 | Tragic 17.9% |