Israeli vs Immigrants from Haiti Receiving Food Stamps
COMPARE
Israeli
Immigrants from Haiti
Receiving Food Stamps
Receiving Food Stamps Comparison
Israelis
Immigrants from Haiti
10.7%
RECEIVING FOOD STAMPS
92.4/ 100
METRIC RATING
130th/ 347
METRIC RANK
18.2%
RECEIVING FOOD STAMPS
0.0/ 100
METRIC RATING
325th/ 347
METRIC RANK
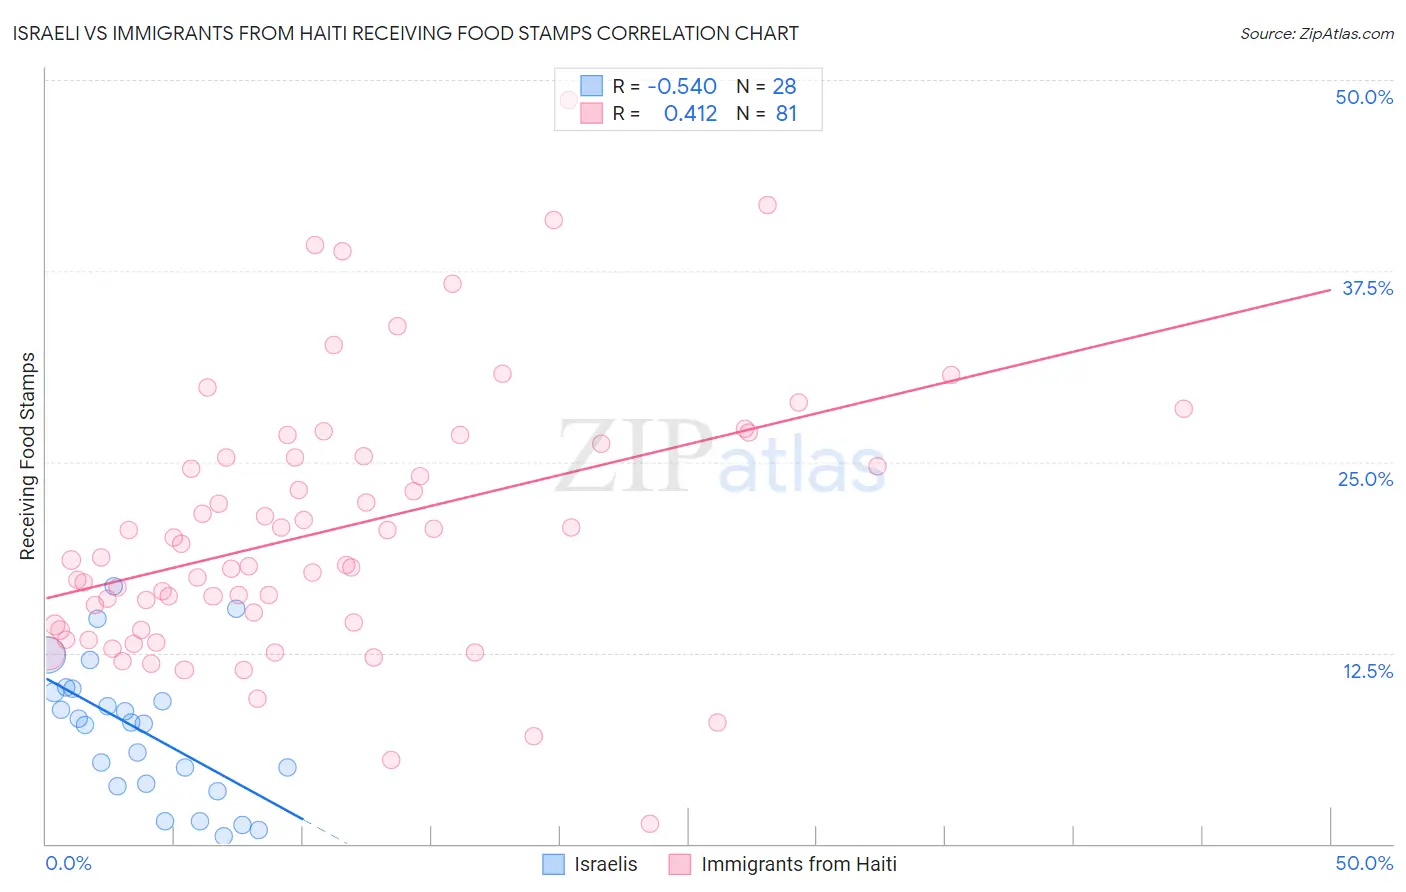
Israeli vs Immigrants from Haiti Receiving Food Stamps Correlation Chart
The statistical analysis conducted on geographies consisting of 210,490,548 people shows a substantial negative correlation between the proportion of Israelis and percentage of population receiving government assistance and/or food stamps in the United States with a correlation coefficient (R) of -0.540 and weighted average of 10.7%. Similarly, the statistical analysis conducted on geographies consisting of 225,016,016 people shows a moderate positive correlation between the proportion of Immigrants from Haiti and percentage of population receiving government assistance and/or food stamps in the United States with a correlation coefficient (R) of 0.412 and weighted average of 18.2%, a difference of 69.9%.
Receiving Food Stamps Correlation Summary
| Measurement | Israeli | Immigrants from Haiti |
| Minimum | 0.50% | 1.3% |
| Maximum | 16.9% | 48.7% |
| Range | 16.4% | 47.4% |
| Mean | 7.4% | 20.5% |
| Median | 7.9% | 18.6% |
| Interquartile 25% (IQ1) | 3.9% | 14.2% |
| Interquartile 75% (IQ3) | 10.0% | 25.4% |
| Interquartile Range (IQR) | 6.2% | 11.2% |
| Standard Deviation (Sample) | 4.5% | 8.7% |
| Standard Deviation (Population) | 4.4% | 8.7% |
Similar Demographics by Receiving Food Stamps
Demographics Similar to Israelis by Receiving Food Stamps
In terms of receiving food stamps, the demographic groups most similar to Israelis are French (10.7%, a difference of 0.0%), Immigrants from Jordan (10.7%, a difference of 0.10%), Yugoslavian (10.7%, a difference of 0.10%), Immigrants from Ethiopia (10.7%, a difference of 0.11%), and Afghan (10.7%, a difference of 0.13%).
| Demographics | Rating | Rank | Receiving Food Stamps |
| Immigrants | Philippines | 93.3 /100 | #123 | Exceptional 10.7% |
| Paraguayans | 93.0 /100 | #124 | Exceptional 10.7% |
| Ukrainians | 92.8 /100 | #125 | Exceptional 10.7% |
| Afghans | 92.6 /100 | #126 | Exceptional 10.7% |
| Immigrants | Ethiopia | 92.6 /100 | #127 | Exceptional 10.7% |
| Immigrants | Jordan | 92.5 /100 | #128 | Exceptional 10.7% |
| Yugoslavians | 92.5 /100 | #129 | Exceptional 10.7% |
| Israelis | 92.4 /100 | #130 | Exceptional 10.7% |
| French | 92.3 /100 | #131 | Exceptional 10.7% |
| Immigrants | Germany | 92.0 /100 | #132 | Exceptional 10.7% |
| Immigrants | Russia | 90.9 /100 | #133 | Exceptional 10.8% |
| Immigrants | Brazil | 90.3 /100 | #134 | Exceptional 10.8% |
| Argentineans | 90.2 /100 | #135 | Exceptional 10.8% |
| Slovaks | 89.8 /100 | #136 | Excellent 10.8% |
| Immigrants | Eastern Europe | 89.8 /100 | #137 | Excellent 10.8% |
Demographics Similar to Immigrants from Haiti by Receiving Food Stamps
In terms of receiving food stamps, the demographic groups most similar to Immigrants from Haiti are Cuban (18.2%, a difference of 0.11%), Apache (18.3%, a difference of 0.42%), Colville (18.3%, a difference of 0.63%), Immigrants from Dominica (18.4%, a difference of 1.1%), and British West Indian (17.9%, a difference of 1.8%).
| Demographics | Rating | Rank | Receiving Food Stamps |
| Menominee | 0.0 /100 | #318 | Tragic 17.2% |
| Immigrants | St. Vincent and the Grenadines | 0.0 /100 | #319 | Tragic 17.2% |
| Immigrants | Nicaragua | 0.0 /100 | #320 | Tragic 17.2% |
| Natives/Alaskans | 0.0 /100 | #321 | Tragic 17.3% |
| Immigrants | Grenada | 0.0 /100 | #322 | Tragic 17.8% |
| Haitians | 0.0 /100 | #323 | Tragic 17.8% |
| British West Indians | 0.0 /100 | #324 | Tragic 17.9% |
| Immigrants | Haiti | 0.0 /100 | #325 | Tragic 18.2% |
| Cubans | 0.0 /100 | #326 | Tragic 18.2% |
| Apache | 0.0 /100 | #327 | Tragic 18.3% |
| Colville | 0.0 /100 | #328 | Tragic 18.3% |
| Immigrants | Dominica | 0.0 /100 | #329 | Tragic 18.4% |
| Pima | 0.0 /100 | #330 | Tragic 19.0% |
| Immigrants | Caribbean | 0.0 /100 | #331 | Tragic 19.6% |
| Pueblo | 0.0 /100 | #332 | Tragic 19.9% |