Cajun vs Immigrants from Micronesia Single Father Poverty
COMPARE
Cajun
Immigrants from Micronesia
Single Father Poverty
Single Father Poverty Comparison
Cajuns
Immigrants from Micronesia
23.1%
SINGLE FATHER POVERTY
0.0/ 100
METRIC RATING
336th/ 347
METRIC RANK
18.6%
SINGLE FATHER POVERTY
0.0/ 100
METRIC RATING
309th/ 347
METRIC RANK
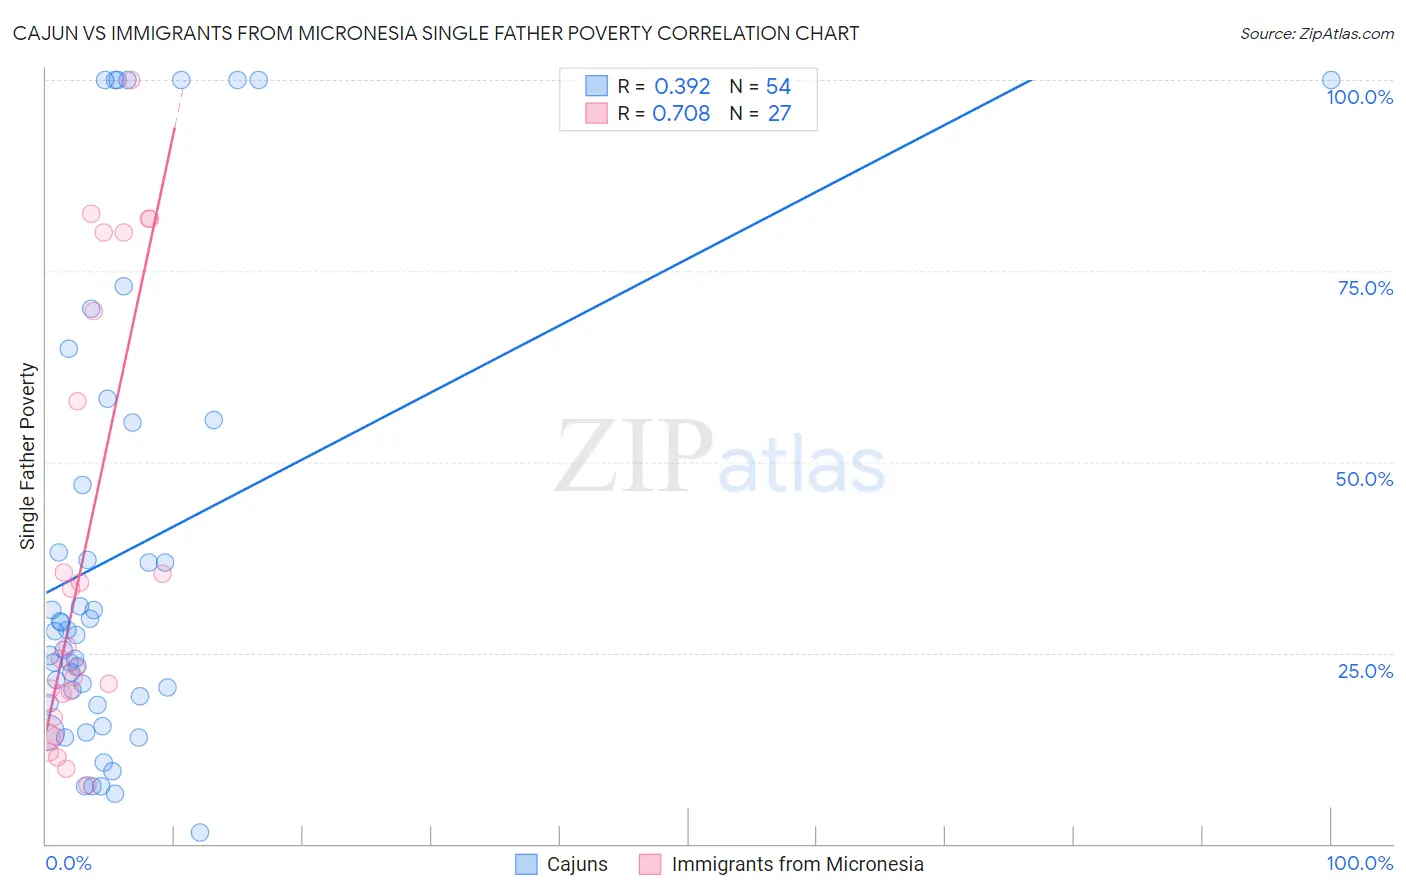
Cajun vs Immigrants from Micronesia Single Father Poverty Correlation Chart
The statistical analysis conducted on geographies consisting of 130,032,102 people shows a mild positive correlation between the proportion of Cajuns and poverty level among single fathers in the United States with a correlation coefficient (R) of 0.392 and weighted average of 23.1%. Similarly, the statistical analysis conducted on geographies consisting of 57,566,995 people shows a strong positive correlation between the proportion of Immigrants from Micronesia and poverty level among single fathers in the United States with a correlation coefficient (R) of 0.708 and weighted average of 18.6%, a difference of 24.1%.
Single Father Poverty Correlation Summary
| Measurement | Cajun | Immigrants from Micronesia |
| Minimum | 1.4% | 7.7% |
| Maximum | 100.0% | 100.0% |
| Range | 98.6% | 92.3% |
| Mean | 38.2% | 38.3% |
| Median | 27.6% | 24.3% |
| Interquartile 25% (IQ1) | 18.4% | 16.6% |
| Interquartile 75% (IQ3) | 55.1% | 69.8% |
| Interquartile Range (IQR) | 36.7% | 53.2% |
| Standard Deviation (Sample) | 30.3% | 28.7% |
| Standard Deviation (Population) | 30.0% | 28.2% |
Similar Demographics by Single Father Poverty
Demographics Similar to Cajuns by Single Father Poverty
In terms of single father poverty, the demographic groups most similar to Cajuns are Shoshone (22.9%, a difference of 0.71%), Kiowa (22.5%, a difference of 2.7%), Native/Alaskan (22.4%, a difference of 3.0%), Sioux (23.9%, a difference of 3.5%), and Arapaho (24.0%, a difference of 3.9%).
| Demographics | Rating | Rank | Single Father Poverty |
| Colville | 0.0 /100 | #329 | Tragic 21.4% |
| Paiute | 0.0 /100 | #330 | Tragic 21.6% |
| Central American Indians | 0.0 /100 | #331 | Tragic 21.7% |
| Tohono O'odham | 0.0 /100 | #332 | Tragic 22.0% |
| Natives/Alaskans | 0.0 /100 | #333 | Tragic 22.4% |
| Kiowa | 0.0 /100 | #334 | Tragic 22.5% |
| Shoshone | 0.0 /100 | #335 | Tragic 22.9% |
| Cajuns | 0.0 /100 | #336 | Tragic 23.1% |
| Sioux | 0.0 /100 | #337 | Tragic 23.9% |
| Arapaho | 0.0 /100 | #338 | Tragic 24.0% |
| Apache | 0.0 /100 | #339 | Tragic 24.2% |
| Houma | 0.0 /100 | #340 | Tragic 26.7% |
| Hopi | 0.0 /100 | #341 | Tragic 27.2% |
| Yuman | 0.0 /100 | #342 | Tragic 28.4% |
| Lumbee | 0.0 /100 | #343 | Tragic 28.5% |
Demographics Similar to Immigrants from Micronesia by Single Father Poverty
In terms of single father poverty, the demographic groups most similar to Immigrants from Micronesia are Ottawa (18.6%, a difference of 0.11%), French Canadian (18.6%, a difference of 0.13%), Scotch-Irish (18.6%, a difference of 0.17%), Blackfeet (18.5%, a difference of 0.39%), and Ute (18.5%, a difference of 0.44%).
| Demographics | Rating | Rank | Single Father Poverty |
| Comanche | 0.0 /100 | #302 | Tragic 18.5% |
| Celtics | 0.0 /100 | #303 | Tragic 18.5% |
| Ute | 0.0 /100 | #304 | Tragic 18.5% |
| Blackfeet | 0.0 /100 | #305 | Tragic 18.5% |
| Scotch-Irish | 0.0 /100 | #306 | Tragic 18.6% |
| French Canadians | 0.0 /100 | #307 | Tragic 18.6% |
| Ottawa | 0.0 /100 | #308 | Tragic 18.6% |
| Immigrants | Micronesia | 0.0 /100 | #309 | Tragic 18.6% |
| Chippewa | 0.0 /100 | #310 | Tragic 18.8% |
| Immigrants | Nonimmigrants | 0.0 /100 | #311 | Tragic 18.8% |
| Immigrants | Dominica | 0.0 /100 | #312 | Tragic 18.9% |
| Potawatomi | 0.0 /100 | #313 | Tragic 18.9% |
| Delaware | 0.0 /100 | #314 | Tragic 18.9% |
| Chickasaw | 0.0 /100 | #315 | Tragic 19.0% |
| Osage | 0.0 /100 | #316 | Tragic 19.0% |