Zimbabwean vs Immigrants from Micronesia 1 or more Vehicles in Household
COMPARE
Zimbabwean
Immigrants from Micronesia
1 or more Vehicles in Household
1 or more Vehicles in Household Comparison
Zimbabweans
Immigrants from Micronesia
91.0%
1 OR MORE VEHICLES IN HOUSEHOLD
97.7/ 100
METRIC RATING
106th/ 347
METRIC RANK
90.1%
1 OR MORE VEHICLES IN HOUSEHOLD
75.9/ 100
METRIC RATING
150th/ 347
METRIC RANK
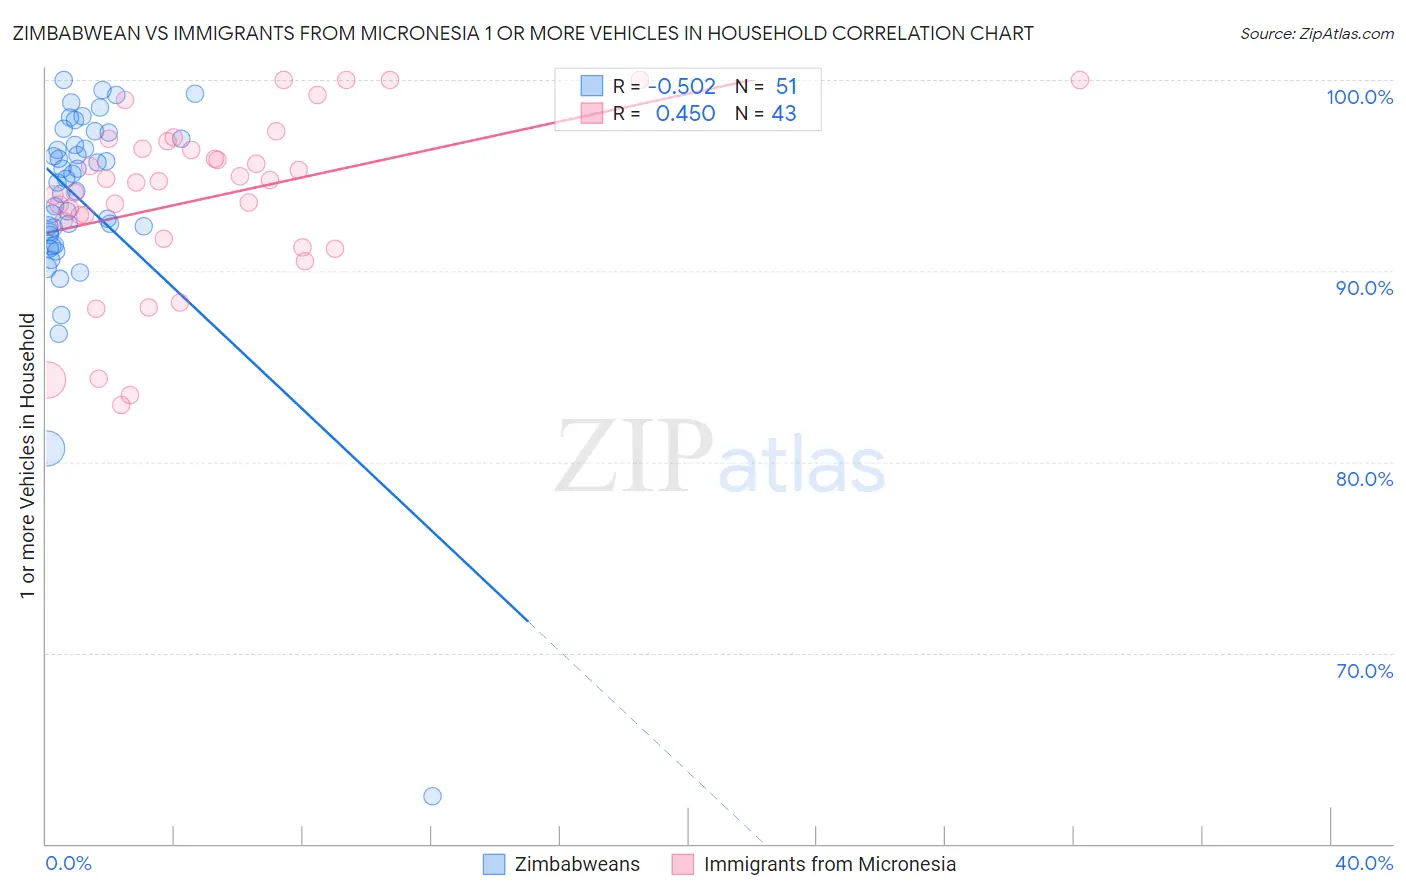
Zimbabwean vs Immigrants from Micronesia 1 or more Vehicles in Household Correlation Chart
The statistical analysis conducted on geographies consisting of 69,192,017 people shows a substantial negative correlation between the proportion of Zimbabweans and percentage of households with 1 or more vehicles available in the United States with a correlation coefficient (R) of -0.502 and weighted average of 91.0%. Similarly, the statistical analysis conducted on geographies consisting of 61,591,588 people shows a moderate positive correlation between the proportion of Immigrants from Micronesia and percentage of households with 1 or more vehicles available in the United States with a correlation coefficient (R) of 0.450 and weighted average of 90.1%, a difference of 1.0%.
1 or more Vehicles in Household Correlation Summary
| Measurement | Zimbabwean | Immigrants from Micronesia |
| Minimum | 62.5% | 83.0% |
| Maximum | 100.0% | 100.0% |
| Range | 37.5% | 17.0% |
| Mean | 93.6% | 93.8% |
| Median | 94.6% | 94.7% |
| Interquartile 25% (IQ1) | 91.9% | 91.7% |
| Interquartile 75% (IQ3) | 96.9% | 96.8% |
| Interquartile Range (IQR) | 5.0% | 5.1% |
| Standard Deviation (Sample) | 5.8% | 4.5% |
| Standard Deviation (Population) | 5.7% | 4.5% |
Similar Demographics by 1 or more Vehicles in Household
Demographics Similar to Zimbabweans by 1 or more Vehicles in Household
In terms of 1 or more vehicles in household, the demographic groups most similar to Zimbabweans are Maltese (91.0%, a difference of 0.020%), Hispanic or Latino (91.0%, a difference of 0.020%), Delaware (91.0%, a difference of 0.020%), Laotian (91.0%, a difference of 0.040%), and Mexican American Indian (91.0%, a difference of 0.050%).
| Demographics | Rating | Rank | 1 or more Vehicles in Household |
| Immigrants | Bolivia | 98.6 /100 | #99 | Exceptional 91.2% |
| Immigrants | Central America | 98.4 /100 | #100 | Exceptional 91.1% |
| Bulgarians | 98.4 /100 | #101 | Exceptional 91.1% |
| Seminole | 98.3 /100 | #102 | Exceptional 91.1% |
| Yugoslavians | 98.3 /100 | #103 | Exceptional 91.1% |
| Asians | 98.2 /100 | #104 | Exceptional 91.1% |
| Laotians | 98.0 /100 | #105 | Exceptional 91.0% |
| Zimbabweans | 97.7 /100 | #106 | Exceptional 91.0% |
| Maltese | 97.7 /100 | #107 | Exceptional 91.0% |
| Hispanics or Latinos | 97.6 /100 | #108 | Exceptional 91.0% |
| Delaware | 97.6 /100 | #109 | Exceptional 91.0% |
| Mexican American Indians | 97.4 /100 | #110 | Exceptional 91.0% |
| Navajo | 95.8 /100 | #111 | Exceptional 90.8% |
| Immigrants | Netherlands | 95.7 /100 | #112 | Exceptional 90.8% |
| Immigrants | Kuwait | 94.7 /100 | #113 | Exceptional 90.7% |
Demographics Similar to Immigrants from Micronesia by 1 or more Vehicles in Household
In terms of 1 or more vehicles in household, the demographic groups most similar to Immigrants from Micronesia are Immigrants from Bosnia and Herzegovina (90.1%, a difference of 0.010%), Immigrants from Nicaragua (90.1%, a difference of 0.020%), Tlingit-Haida (90.1%, a difference of 0.030%), New Zealander (90.1%, a difference of 0.040%), and Immigrants from Uganda (90.1%, a difference of 0.040%).
| Demographics | Rating | Rank | 1 or more Vehicles in Household |
| Immigrants | Bahamas | 81.5 /100 | #143 | Excellent 90.2% |
| Immigrants | Zimbabwe | 81.5 /100 | #144 | Excellent 90.2% |
| Sioux | 81.3 /100 | #145 | Excellent 90.2% |
| Bahamians | 80.5 /100 | #146 | Excellent 90.2% |
| Chileans | 79.8 /100 | #147 | Good 90.2% |
| Immigrants | Eastern Africa | 78.2 /100 | #148 | Good 90.1% |
| Immigrants | Nicaragua | 76.7 /100 | #149 | Good 90.1% |
| Immigrants | Micronesia | 75.9 /100 | #150 | Good 90.1% |
| Immigrants | Bosnia and Herzegovina | 75.4 /100 | #151 | Good 90.1% |
| Tlingit-Haida | 74.3 /100 | #152 | Good 90.1% |
| New Zealanders | 73.8 /100 | #153 | Good 90.1% |
| Immigrants | Uganda | 73.8 /100 | #154 | Good 90.1% |
| Immigrants | Immigrants | 73.6 /100 | #155 | Good 90.1% |
| Australians | 72.4 /100 | #156 | Good 90.0% |
| Immigrants | Congo | 71.2 /100 | #157 | Good 90.0% |