Zimbabwean vs Immigrants from Micronesia Male Disability
COMPARE
Zimbabwean
Immigrants from Micronesia
Male Disability
Male Disability Comparison
Zimbabweans
Immigrants from Micronesia
10.6%
MALE DISABILITY
98.4/ 100
METRIC RATING
79th/ 347
METRIC RANK
12.9%
MALE DISABILITY
0.0/ 100
METRIC RATING
295th/ 347
METRIC RANK
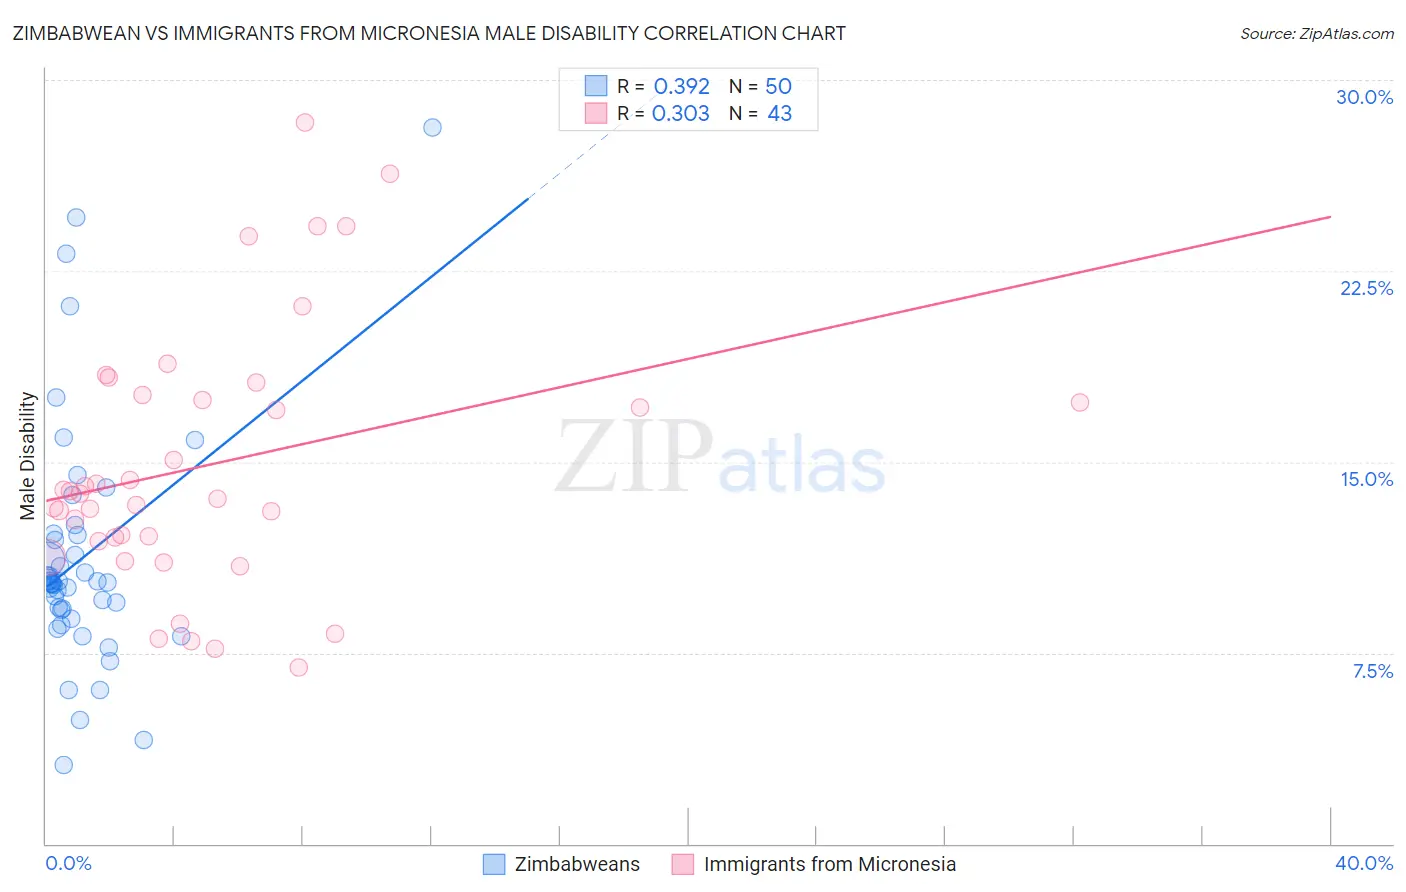
Zimbabwean vs Immigrants from Micronesia Male Disability Correlation Chart
The statistical analysis conducted on geographies consisting of 69,206,379 people shows a mild positive correlation between the proportion of Zimbabweans and percentage of males with a disability in the United States with a correlation coefficient (R) of 0.392 and weighted average of 10.6%. Similarly, the statistical analysis conducted on geographies consisting of 61,603,826 people shows a mild positive correlation between the proportion of Immigrants from Micronesia and percentage of males with a disability in the United States with a correlation coefficient (R) of 0.303 and weighted average of 12.9%, a difference of 22.2%.
Male Disability Correlation Summary
| Measurement | Zimbabwean | Immigrants from Micronesia |
| Minimum | 3.1% | 6.9% |
| Maximum | 28.1% | 28.3% |
| Range | 25.0% | 21.4% |
| Mean | 11.3% | 14.9% |
| Median | 10.2% | 13.8% |
| Interquartile 25% (IQ1) | 9.2% | 11.9% |
| Interquartile 75% (IQ3) | 12.1% | 17.6% |
| Interquartile Range (IQR) | 2.9% | 5.7% |
| Standard Deviation (Sample) | 4.8% | 5.1% |
| Standard Deviation (Population) | 4.8% | 5.0% |
Similar Demographics by Male Disability
Demographics Similar to Zimbabweans by Male Disability
In terms of male disability, the demographic groups most similar to Zimbabweans are Immigrants from Jordan (10.6%, a difference of 0.020%), Immigrants from Chile (10.6%, a difference of 0.080%), Immigrants from Guyana (10.6%, a difference of 0.15%), Immigrants from Poland (10.6%, a difference of 0.21%), and Bulgarian (10.6%, a difference of 0.22%).
| Demographics | Rating | Rank | Male Disability |
| Immigrants | Serbia | 99.0 /100 | #72 | Exceptional 10.5% |
| Immigrants | Lithuania | 98.9 /100 | #73 | Exceptional 10.5% |
| Immigrants | Lebanon | 98.8 /100 | #74 | Exceptional 10.5% |
| Sierra Leoneans | 98.7 /100 | #75 | Exceptional 10.5% |
| Immigrants | Sierra Leone | 98.7 /100 | #76 | Exceptional 10.5% |
| Laotians | 98.6 /100 | #77 | Exceptional 10.6% |
| Immigrants | Russia | 98.6 /100 | #78 | Exceptional 10.6% |
| Zimbabweans | 98.4 /100 | #79 | Exceptional 10.6% |
| Immigrants | Jordan | 98.4 /100 | #80 | Exceptional 10.6% |
| Immigrants | Chile | 98.3 /100 | #81 | Exceptional 10.6% |
| Immigrants | Guyana | 98.2 /100 | #82 | Exceptional 10.6% |
| Immigrants | Poland | 98.1 /100 | #83 | Exceptional 10.6% |
| Bulgarians | 98.1 /100 | #84 | Exceptional 10.6% |
| Sri Lankans | 97.9 /100 | #85 | Exceptional 10.6% |
| Immigrants | Ireland | 97.9 /100 | #86 | Exceptional 10.6% |
Demographics Similar to Immigrants from Micronesia by Male Disability
In terms of male disability, the demographic groups most similar to Immigrants from Micronesia are Nonimmigrants (12.9%, a difference of 0.070%), Marshallese (12.9%, a difference of 0.10%), Inupiat (13.0%, a difference of 0.17%), Yaqui (12.9%, a difference of 0.33%), and Pennsylvania German (13.0%, a difference of 0.37%).
| Demographics | Rating | Rank | Male Disability |
| Yup'ik | 0.0 /100 | #288 | Tragic 12.8% |
| Immigrants | Cabo Verde | 0.0 /100 | #289 | Tragic 12.8% |
| Pima | 0.0 /100 | #290 | Tragic 12.8% |
| Whites/Caucasians | 0.0 /100 | #291 | Tragic 12.8% |
| English | 0.0 /100 | #292 | Tragic 12.8% |
| Yaqui | 0.0 /100 | #293 | Tragic 12.9% |
| Marshallese | 0.0 /100 | #294 | Tragic 12.9% |
| Immigrants | Micronesia | 0.0 /100 | #295 | Tragic 12.9% |
| Immigrants | Nonimmigrants | 0.0 /100 | #296 | Tragic 12.9% |
| Inupiat | 0.0 /100 | #297 | Tragic 13.0% |
| Pennsylvania Germans | 0.0 /100 | #298 | Tragic 13.0% |
| Celtics | 0.0 /100 | #299 | Tragic 13.0% |
| Cheyenne | 0.0 /100 | #300 | Tragic 13.0% |
| French | 0.0 /100 | #301 | Tragic 13.0% |
| Crow | 0.0 /100 | #302 | Tragic 13.1% |