Immigrants from Thailand vs Immigrants from Micronesia Single Father Poverty
COMPARE
Immigrants from Thailand
Immigrants from Micronesia
Single Father Poverty
Single Father Poverty Comparison
Immigrants from Thailand
Immigrants from Micronesia
15.8%
SINGLE FATHER POVERTY
93.6/ 100
METRIC RATING
115th/ 347
METRIC RANK
18.6%
SINGLE FATHER POVERTY
0.0/ 100
METRIC RATING
309th/ 347
METRIC RANK
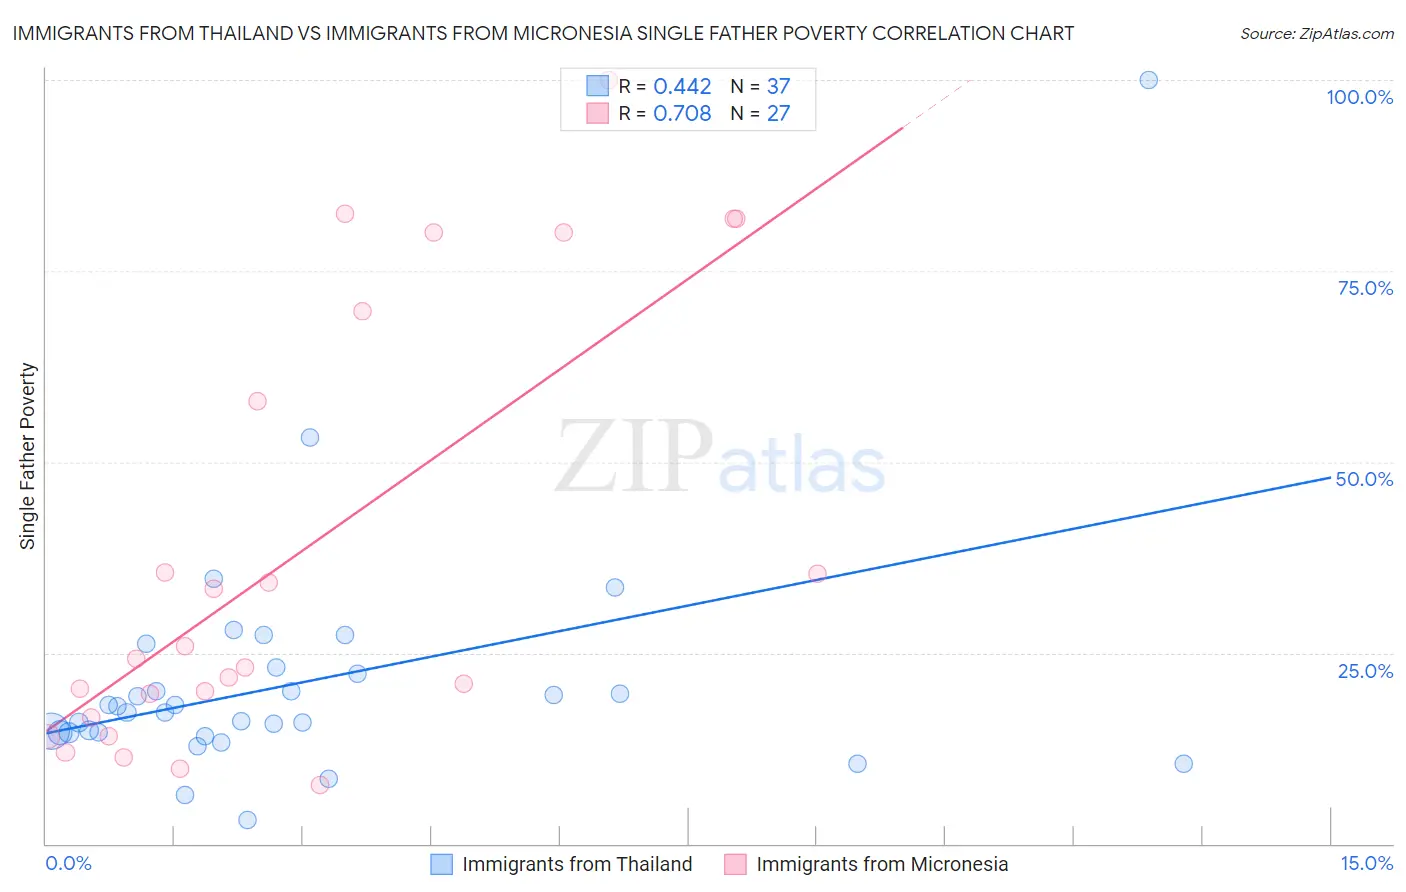
Immigrants from Thailand vs Immigrants from Micronesia Single Father Poverty Correlation Chart
The statistical analysis conducted on geographies consisting of 261,118,705 people shows a moderate positive correlation between the proportion of Immigrants from Thailand and poverty level among single fathers in the United States with a correlation coefficient (R) of 0.442 and weighted average of 15.8%. Similarly, the statistical analysis conducted on geographies consisting of 57,566,995 people shows a strong positive correlation between the proportion of Immigrants from Micronesia and poverty level among single fathers in the United States with a correlation coefficient (R) of 0.708 and weighted average of 18.6%, a difference of 17.6%.
Single Father Poverty Correlation Summary
| Measurement | Immigrants from Thailand | Immigrants from Micronesia |
| Minimum | 3.1% | 7.7% |
| Maximum | 100.0% | 100.0% |
| Range | 96.9% | 92.3% |
| Mean | 21.0% | 38.3% |
| Median | 17.2% | 24.3% |
| Interquartile 25% (IQ1) | 14.5% | 16.6% |
| Interquartile 75% (IQ3) | 22.7% | 69.8% |
| Interquartile Range (IQR) | 8.2% | 53.2% |
| Standard Deviation (Sample) | 16.0% | 28.7% |
| Standard Deviation (Population) | 15.8% | 28.2% |
Similar Demographics by Single Father Poverty
Demographics Similar to Immigrants from Thailand by Single Father Poverty
In terms of single father poverty, the demographic groups most similar to Immigrants from Thailand are Immigrants from Argentina (15.8%, a difference of 0.14%), Argentinean (15.8%, a difference of 0.17%), Immigrants from Colombia (15.8%, a difference of 0.17%), Danish (15.8%, a difference of 0.19%), and Immigrants from Eastern Europe (15.8%, a difference of 0.19%).
| Demographics | Rating | Rank | Single Father Poverty |
| Pakistanis | 95.7 /100 | #108 | Exceptional 15.7% |
| Turks | 95.1 /100 | #109 | Exceptional 15.8% |
| Immigrants | Africa | 95.1 /100 | #110 | Exceptional 15.8% |
| Bulgarians | 94.8 /100 | #111 | Exceptional 15.8% |
| Immigrants | Latvia | 94.7 /100 | #112 | Exceptional 15.8% |
| Danes | 94.5 /100 | #113 | Exceptional 15.8% |
| Argentineans | 94.4 /100 | #114 | Exceptional 15.8% |
| Immigrants | Thailand | 93.6 /100 | #115 | Exceptional 15.8% |
| Immigrants | Argentina | 92.8 /100 | #116 | Exceptional 15.8% |
| Immigrants | Colombia | 92.6 /100 | #117 | Exceptional 15.8% |
| Immigrants | Eastern Europe | 92.5 /100 | #118 | Exceptional 15.8% |
| Immigrants | Belarus | 92.4 /100 | #119 | Exceptional 15.8% |
| Uruguayans | 92.1 /100 | #120 | Exceptional 15.9% |
| Immigrants | Immigrants | 91.9 /100 | #121 | Exceptional 15.9% |
| Sudanese | 91.6 /100 | #122 | Exceptional 15.9% |
Demographics Similar to Immigrants from Micronesia by Single Father Poverty
In terms of single father poverty, the demographic groups most similar to Immigrants from Micronesia are Ottawa (18.6%, a difference of 0.11%), French Canadian (18.6%, a difference of 0.13%), Scotch-Irish (18.6%, a difference of 0.17%), Blackfeet (18.5%, a difference of 0.39%), and Ute (18.5%, a difference of 0.44%).
| Demographics | Rating | Rank | Single Father Poverty |
| Comanche | 0.0 /100 | #302 | Tragic 18.5% |
| Celtics | 0.0 /100 | #303 | Tragic 18.5% |
| Ute | 0.0 /100 | #304 | Tragic 18.5% |
| Blackfeet | 0.0 /100 | #305 | Tragic 18.5% |
| Scotch-Irish | 0.0 /100 | #306 | Tragic 18.6% |
| French Canadians | 0.0 /100 | #307 | Tragic 18.6% |
| Ottawa | 0.0 /100 | #308 | Tragic 18.6% |
| Immigrants | Micronesia | 0.0 /100 | #309 | Tragic 18.6% |
| Chippewa | 0.0 /100 | #310 | Tragic 18.8% |
| Immigrants | Nonimmigrants | 0.0 /100 | #311 | Tragic 18.8% |
| Immigrants | Dominica | 0.0 /100 | #312 | Tragic 18.9% |
| Potawatomi | 0.0 /100 | #313 | Tragic 18.9% |
| Delaware | 0.0 /100 | #314 | Tragic 18.9% |
| Chickasaw | 0.0 /100 | #315 | Tragic 19.0% |
| Osage | 0.0 /100 | #316 | Tragic 19.0% |