Nigerian vs Immigrants from Micronesia Single Father Poverty
COMPARE
Nigerian
Immigrants from Micronesia
Single Father Poverty
Single Father Poverty Comparison
Nigerians
Immigrants from Micronesia
16.1%
SINGLE FATHER POVERTY
76.8/ 100
METRIC RATING
148th/ 347
METRIC RANK
18.6%
SINGLE FATHER POVERTY
0.0/ 100
METRIC RATING
309th/ 347
METRIC RANK
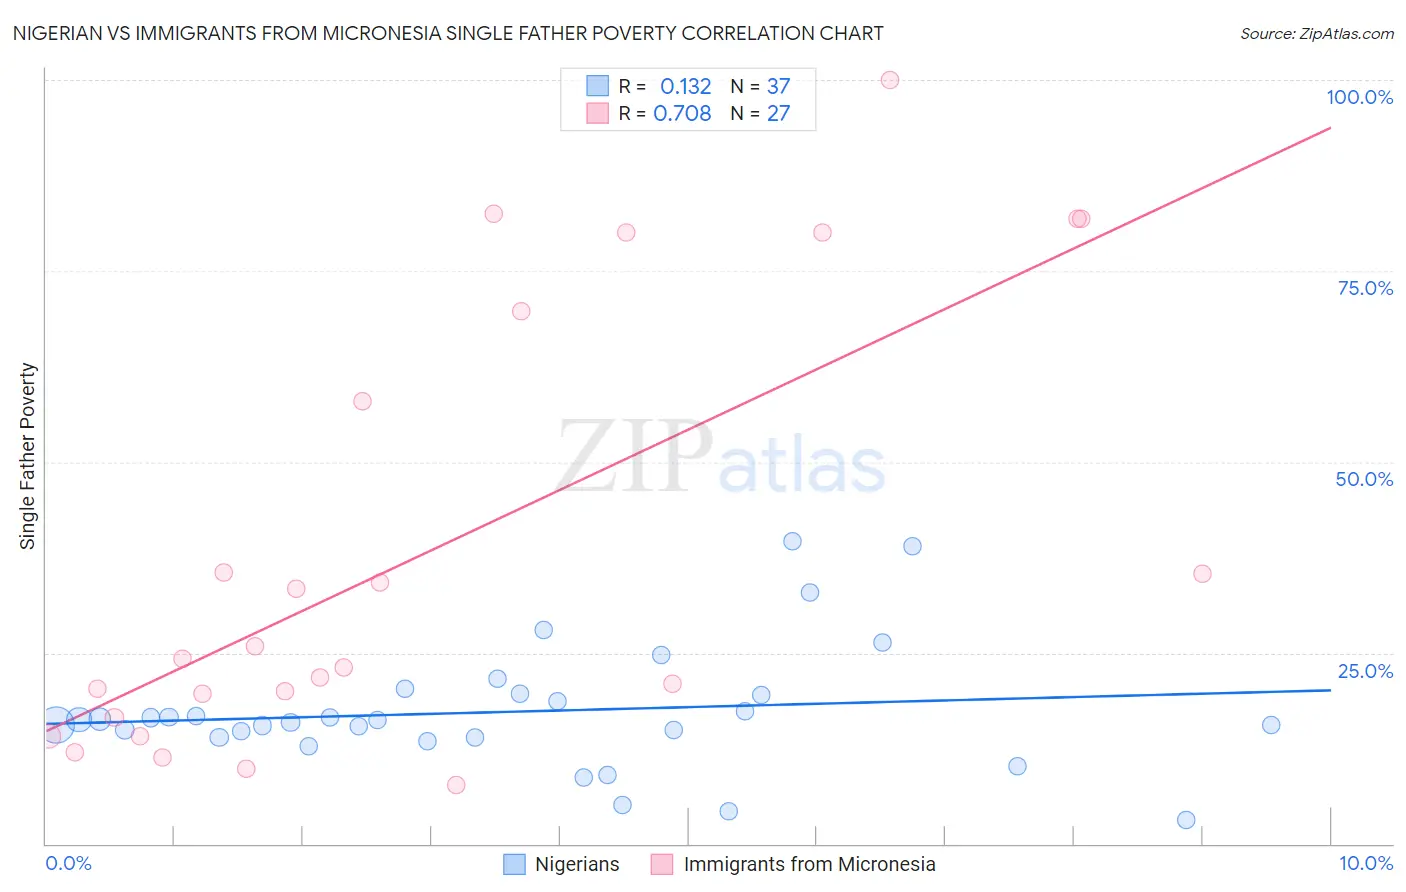
Nigerian vs Immigrants from Micronesia Single Father Poverty Correlation Chart
The statistical analysis conducted on geographies consisting of 274,896,002 people shows a poor positive correlation between the proportion of Nigerians and poverty level among single fathers in the United States with a correlation coefficient (R) of 0.132 and weighted average of 16.1%. Similarly, the statistical analysis conducted on geographies consisting of 57,566,995 people shows a strong positive correlation between the proportion of Immigrants from Micronesia and poverty level among single fathers in the United States with a correlation coefficient (R) of 0.708 and weighted average of 18.6%, a difference of 15.6%.
Single Father Poverty Correlation Summary
| Measurement | Nigerian | Immigrants from Micronesia |
| Minimum | 3.1% | 7.7% |
| Maximum | 39.7% | 100.0% |
| Range | 36.6% | 92.3% |
| Mean | 17.3% | 38.3% |
| Median | 16.2% | 24.3% |
| Interquartile 25% (IQ1) | 13.9% | 16.6% |
| Interquartile 75% (IQ3) | 19.6% | 69.8% |
| Interquartile Range (IQR) | 5.7% | 53.2% |
| Standard Deviation (Sample) | 8.0% | 28.7% |
| Standard Deviation (Population) | 7.9% | 28.2% |
Similar Demographics by Single Father Poverty
Demographics Similar to Nigerians by Single Father Poverty
In terms of single father poverty, the demographic groups most similar to Nigerians are Colombian (16.1%, a difference of 0.020%), Immigrants from Hungary (16.1%, a difference of 0.10%), South African (16.1%, a difference of 0.10%), Jordanian (16.1%, a difference of 0.16%), and Immigrants from France (16.1%, a difference of 0.22%).
| Demographics | Rating | Rank | Single Father Poverty |
| Liberians | 83.3 /100 | #141 | Excellent 16.0% |
| Immigrants | Mexico | 83.3 /100 | #142 | Excellent 16.0% |
| Immigrants | Central America | 83.1 /100 | #143 | Excellent 16.0% |
| Immigrants | Kuwait | 81.4 /100 | #144 | Excellent 16.0% |
| Immigrants | Western Asia | 80.7 /100 | #145 | Excellent 16.0% |
| Immigrants | Hungary | 78.3 /100 | #146 | Good 16.1% |
| Colombians | 77.1 /100 | #147 | Good 16.1% |
| Nigerians | 76.8 /100 | #148 | Good 16.1% |
| South Africans | 75.1 /100 | #149 | Good 16.1% |
| Jordanians | 74.2 /100 | #150 | Good 16.1% |
| Immigrants | France | 73.1 /100 | #151 | Good 16.1% |
| Immigrants | Zimbabwe | 72.1 /100 | #152 | Good 16.1% |
| Immigrants | Israel | 72.0 /100 | #153 | Good 16.1% |
| Mexicans | 70.1 /100 | #154 | Good 16.1% |
| Immigrants | Nicaragua | 67.8 /100 | #155 | Good 16.2% |
Demographics Similar to Immigrants from Micronesia by Single Father Poverty
In terms of single father poverty, the demographic groups most similar to Immigrants from Micronesia are Ottawa (18.6%, a difference of 0.11%), French Canadian (18.6%, a difference of 0.13%), Scotch-Irish (18.6%, a difference of 0.17%), Blackfeet (18.5%, a difference of 0.39%), and Ute (18.5%, a difference of 0.44%).
| Demographics | Rating | Rank | Single Father Poverty |
| Comanche | 0.0 /100 | #302 | Tragic 18.5% |
| Celtics | 0.0 /100 | #303 | Tragic 18.5% |
| Ute | 0.0 /100 | #304 | Tragic 18.5% |
| Blackfeet | 0.0 /100 | #305 | Tragic 18.5% |
| Scotch-Irish | 0.0 /100 | #306 | Tragic 18.6% |
| French Canadians | 0.0 /100 | #307 | Tragic 18.6% |
| Ottawa | 0.0 /100 | #308 | Tragic 18.6% |
| Immigrants | Micronesia | 0.0 /100 | #309 | Tragic 18.6% |
| Chippewa | 0.0 /100 | #310 | Tragic 18.8% |
| Immigrants | Nonimmigrants | 0.0 /100 | #311 | Tragic 18.8% |
| Immigrants | Dominica | 0.0 /100 | #312 | Tragic 18.9% |
| Potawatomi | 0.0 /100 | #313 | Tragic 18.9% |
| Delaware | 0.0 /100 | #314 | Tragic 18.9% |
| Chickasaw | 0.0 /100 | #315 | Tragic 19.0% |
| Osage | 0.0 /100 | #316 | Tragic 19.0% |