Zimbabwean vs Immigrants from Micronesia Married-couple Households
COMPARE
Zimbabwean
Immigrants from Micronesia
Married-couple Households
Married-couple Households Comparison
Zimbabweans
Immigrants from Micronesia
47.4%
MARRIED-COUPLE HOUSEHOLDS
89.2/ 100
METRIC RATING
124th/ 347
METRIC RANK
44.9%
MARRIED-COUPLE HOUSEHOLDS
2.6/ 100
METRIC RATING
224th/ 347
METRIC RANK
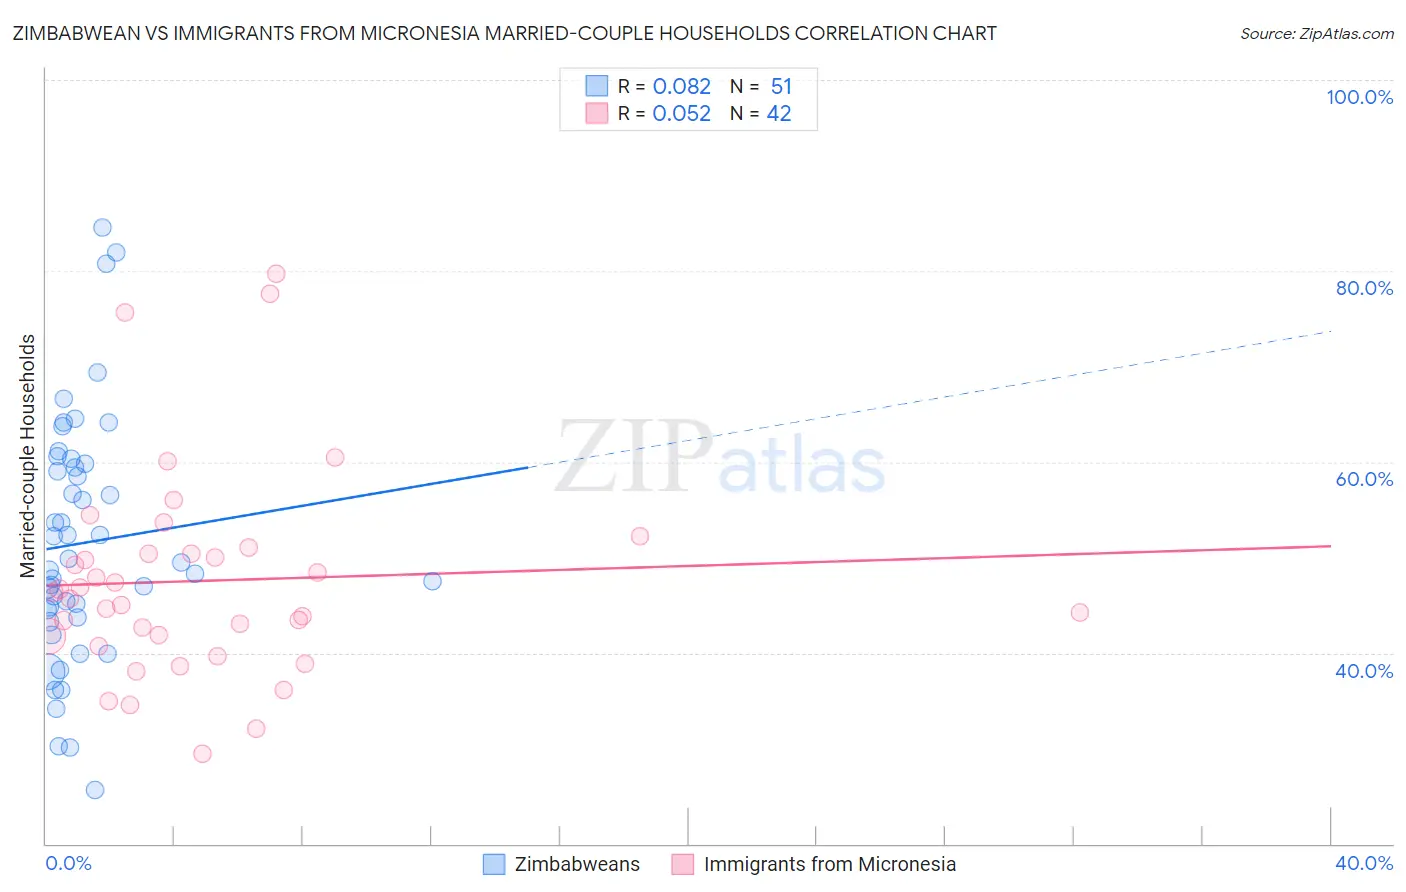
Zimbabwean vs Immigrants from Micronesia Married-couple Households Correlation Chart
The statistical analysis conducted on geographies consisting of 69,192,017 people shows a slight positive correlation between the proportion of Zimbabweans and percentage of married-couple family households in the United States with a correlation coefficient (R) of 0.082 and weighted average of 47.4%. Similarly, the statistical analysis conducted on geographies consisting of 61,600,267 people shows a slight positive correlation between the proportion of Immigrants from Micronesia and percentage of married-couple family households in the United States with a correlation coefficient (R) of 0.052 and weighted average of 44.9%, a difference of 5.6%.
Married-couple Households Correlation Summary
| Measurement | Zimbabwean | Immigrants from Micronesia |
| Minimum | 25.7% | 29.5% |
| Maximum | 84.6% | 79.7% |
| Range | 58.9% | 50.3% |
| Mean | 51.5% | 47.5% |
| Median | 49.5% | 45.9% |
| Interquartile 25% (IQ1) | 43.8% | 41.7% |
| Interquartile 75% (IQ3) | 59.8% | 50.4% |
| Interquartile Range (IQR) | 16.0% | 8.7% |
| Standard Deviation (Sample) | 12.8% | 10.9% |
| Standard Deviation (Population) | 12.6% | 10.7% |
Similar Demographics by Married-couple Households
Demographics Similar to Zimbabweans by Married-couple Households
In terms of married-couple households, the demographic groups most similar to Zimbabweans are Immigrants from Venezuela (47.4%, a difference of 0.010%), Australian (47.4%, a difference of 0.020%), Pakistani (47.3%, a difference of 0.050%), Okinawan (47.4%, a difference of 0.090%), and Celtic (47.3%, a difference of 0.10%).
| Demographics | Rating | Rank | Married-couple Households |
| French Canadians | 92.4 /100 | #117 | Exceptional 47.5% |
| Immigrants | Germany | 92.4 /100 | #118 | Exceptional 47.5% |
| Chileans | 92.2 /100 | #119 | Exceptional 47.5% |
| Puget Sound Salish | 90.5 /100 | #120 | Exceptional 47.4% |
| Immigrants | Eastern Europe | 90.3 /100 | #121 | Exceptional 47.4% |
| Okinawans | 90.1 /100 | #122 | Exceptional 47.4% |
| Immigrants | Venezuela | 89.3 /100 | #123 | Excellent 47.4% |
| Zimbabweans | 89.2 /100 | #124 | Excellent 47.4% |
| Australians | 89.0 /100 | #125 | Excellent 47.4% |
| Pakistanis | 88.6 /100 | #126 | Excellent 47.3% |
| Celtics | 88.1 /100 | #127 | Excellent 47.3% |
| Immigrants | Peru | 87.9 /100 | #128 | Excellent 47.3% |
| Immigrants | Iraq | 87.8 /100 | #129 | Excellent 47.3% |
| Immigrants | Hungary | 87.8 /100 | #130 | Excellent 47.3% |
| Immigrants | Denmark | 87.5 /100 | #131 | Excellent 47.3% |
Demographics Similar to Immigrants from Micronesia by Married-couple Households
In terms of married-couple households, the demographic groups most similar to Immigrants from Micronesia are Dutch West Indian (44.9%, a difference of 0.020%), Immigrants from Cambodia (44.9%, a difference of 0.030%), Alsatian (44.8%, a difference of 0.12%), Salvadoran (44.7%, a difference of 0.31%), and Kenyan (44.7%, a difference of 0.43%).
| Demographics | Rating | Rank | Married-couple Households |
| Panamanians | 5.5 /100 | #217 | Tragic 45.2% |
| Immigrants | Azores | 5.3 /100 | #218 | Tragic 45.2% |
| Nicaraguans | 5.3 /100 | #219 | Tragic 45.2% |
| Immigrants | Thailand | 5.1 /100 | #220 | Tragic 45.2% |
| Tlingit-Haida | 4.9 /100 | #221 | Tragic 45.1% |
| Immigrants | Laos | 4.6 /100 | #222 | Tragic 45.1% |
| Immigrants | Cambodia | 2.7 /100 | #223 | Tragic 44.9% |
| Immigrants | Micronesia | 2.6 /100 | #224 | Tragic 44.9% |
| Dutch West Indians | 2.6 /100 | #225 | Tragic 44.9% |
| Alsatians | 2.3 /100 | #226 | Tragic 44.8% |
| Salvadorans | 1.9 /100 | #227 | Tragic 44.7% |
| Kenyans | 1.7 /100 | #228 | Tragic 44.7% |
| Immigrants | Latin America | 1.6 /100 | #229 | Tragic 44.7% |
| Soviet Union | 1.6 /100 | #230 | Tragic 44.6% |
| Houma | 1.5 /100 | #231 | Tragic 44.6% |