Immigrants from Costa Rica vs Colville Married-Couple Family Poverty
COMPARE
Immigrants from Costa Rica
Colville
Married-Couple Family Poverty
Married-Couple Family Poverty Comparison
Immigrants from Costa Rica
Colville
5.4%
MARRIED-COUPLE FAMILY POVERTY
19.4/ 100
METRIC RATING
204th/ 347
METRIC RANK
6.3%
MARRIED-COUPLE FAMILY POVERTY
0.1/ 100
METRIC RATING
273rd/ 347
METRIC RANK
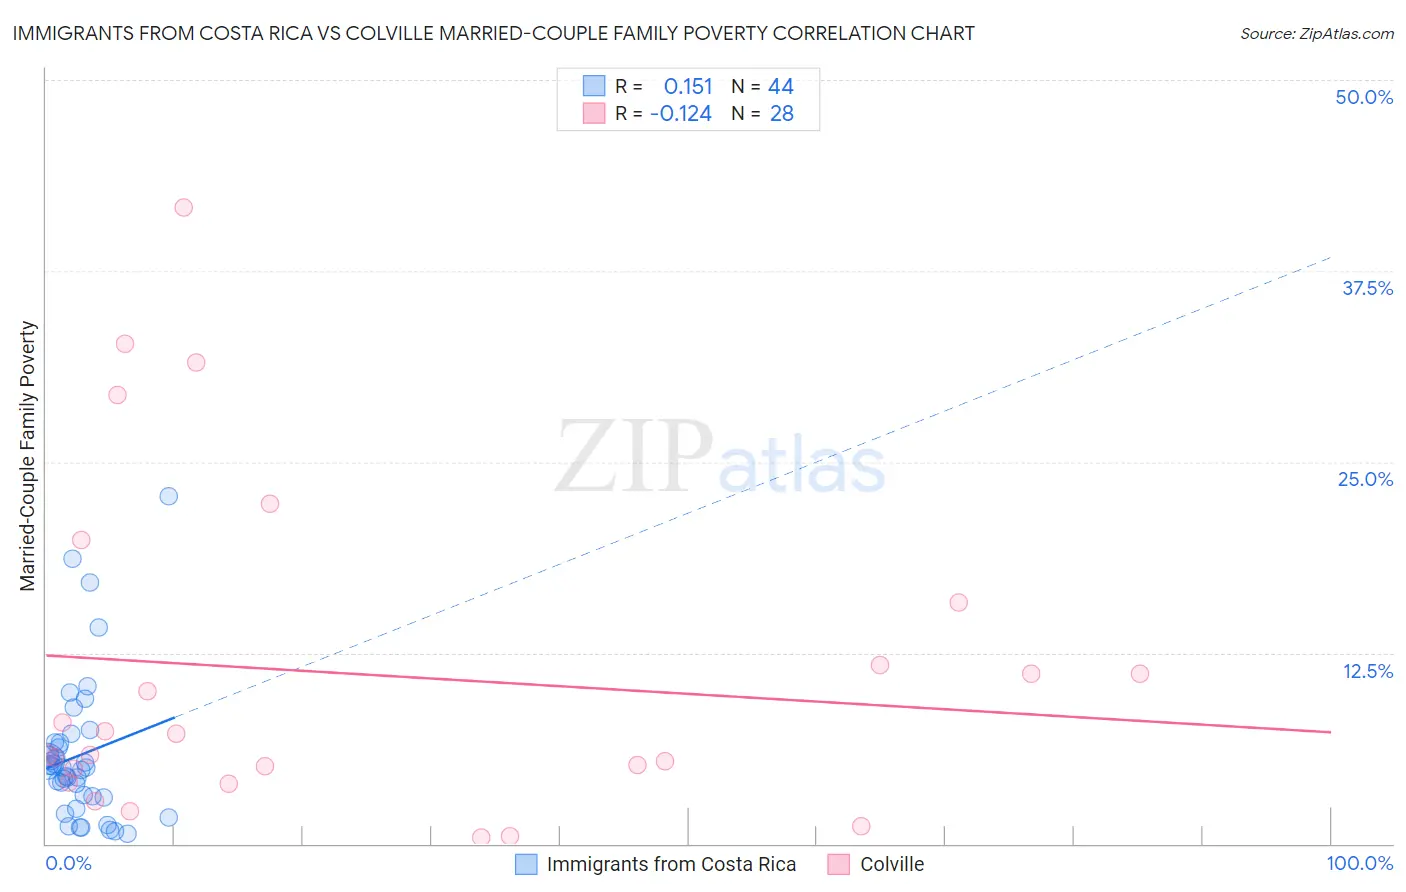
Immigrants from Costa Rica vs Colville Married-Couple Family Poverty Correlation Chart
The statistical analysis conducted on geographies consisting of 203,682,696 people shows a poor positive correlation between the proportion of Immigrants from Costa Rica and poverty level among married-couple families in the United States with a correlation coefficient (R) of 0.151 and weighted average of 5.4%. Similarly, the statistical analysis conducted on geographies consisting of 34,633,773 people shows a poor negative correlation between the proportion of Colville and poverty level among married-couple families in the United States with a correlation coefficient (R) of -0.124 and weighted average of 6.3%, a difference of 15.6%.
Married-Couple Family Poverty Correlation Summary
| Measurement | Immigrants from Costa Rica | Colville |
| Minimum | 0.67% | 0.42% |
| Maximum | 22.7% | 41.7% |
| Range | 22.1% | 41.2% |
| Mean | 5.8% | 11.2% |
| Median | 5.0% | 6.5% |
| Interquartile 25% (IQ1) | 3.1% | 4.4% |
| Interquartile 75% (IQ3) | 6.6% | 13.7% |
| Interquartile Range (IQR) | 3.5% | 9.3% |
| Standard Deviation (Sample) | 4.7% | 10.9% |
| Standard Deviation (Population) | 4.7% | 10.7% |
Similar Demographics by Married-Couple Family Poverty
Demographics Similar to Immigrants from Costa Rica by Married-Couple Family Poverty
In terms of married-couple family poverty, the demographic groups most similar to Immigrants from Costa Rica are Chippewa (5.4%, a difference of 0.080%), Osage (5.4%, a difference of 0.19%), Immigrants from Africa (5.5%, a difference of 0.33%), Immigrants from Peru (5.4%, a difference of 0.41%), and French American Indian (5.5%, a difference of 0.64%).
| Demographics | Rating | Rank | Married-Couple Family Poverty |
| Liberians | 26.3 /100 | #197 | Fair 5.4% |
| Immigrants | Belarus | 26.2 /100 | #198 | Fair 5.4% |
| Uruguayans | 25.0 /100 | #199 | Fair 5.4% |
| Immigrants | Morocco | 24.3 /100 | #200 | Fair 5.4% |
| Lebanese | 24.1 /100 | #201 | Fair 5.4% |
| Immigrants | Middle Africa | 23.8 /100 | #202 | Fair 5.4% |
| Immigrants | Peru | 21.8 /100 | #203 | Fair 5.4% |
| Immigrants | Costa Rica | 19.4 /100 | #204 | Poor 5.4% |
| Chippewa | 18.9 /100 | #205 | Poor 5.4% |
| Osage | 18.4 /100 | #206 | Poor 5.4% |
| Immigrants | Africa | 17.6 /100 | #207 | Poor 5.5% |
| French American Indians | 16.1 /100 | #208 | Poor 5.5% |
| Immigrants | Syria | 15.4 /100 | #209 | Poor 5.5% |
| Immigrants | Micronesia | 14.4 /100 | #210 | Poor 5.5% |
| Nigerians | 14.3 /100 | #211 | Poor 5.5% |
Demographics Similar to Colville by Married-Couple Family Poverty
In terms of married-couple family poverty, the demographic groups most similar to Colville are Barbadian (6.3%, a difference of 0.050%), Choctaw (6.3%, a difference of 0.21%), Yaqui (6.3%, a difference of 0.66%), Trinidadian and Tobagonian (6.2%, a difference of 0.78%), and Indonesian (6.3%, a difference of 0.80%).
| Demographics | Rating | Rank | Married-Couple Family Poverty |
| Creek | 0.2 /100 | #266 | Tragic 6.2% |
| Spanish Americans | 0.2 /100 | #267 | Tragic 6.2% |
| Alaska Natives | 0.2 /100 | #268 | Tragic 6.2% |
| Immigrants | West Indies | 0.1 /100 | #269 | Tragic 6.2% |
| Immigrants | Jamaica | 0.1 /100 | #270 | Tragic 6.2% |
| Immigrants | Bahamas | 0.1 /100 | #271 | Tragic 6.2% |
| Trinidadians and Tobagonians | 0.1 /100 | #272 | Tragic 6.2% |
| Colville | 0.1 /100 | #273 | Tragic 6.3% |
| Barbadians | 0.1 /100 | #274 | Tragic 6.3% |
| Choctaw | 0.1 /100 | #275 | Tragic 6.3% |
| Yaqui | 0.1 /100 | #276 | Tragic 6.3% |
| Indonesians | 0.1 /100 | #277 | Tragic 6.3% |
| Immigrants | Trinidad and Tobago | 0.1 /100 | #278 | Tragic 6.4% |
| Houma | 0.0 /100 | #279 | Tragic 6.4% |
| West Indians | 0.0 /100 | #280 | Tragic 6.4% |