Native/Alaskan vs Colville Married-Couple Family Poverty
COMPARE
Native/Alaskan
Colville
Married-Couple Family Poverty
Married-Couple Family Poverty Comparison
Natives/Alaskans
Colville
8.2%
MARRIED-COUPLE FAMILY POVERTY
0.0/ 100
METRIC RATING
329th/ 347
METRIC RANK
6.3%
MARRIED-COUPLE FAMILY POVERTY
0.1/ 100
METRIC RATING
273rd/ 347
METRIC RANK
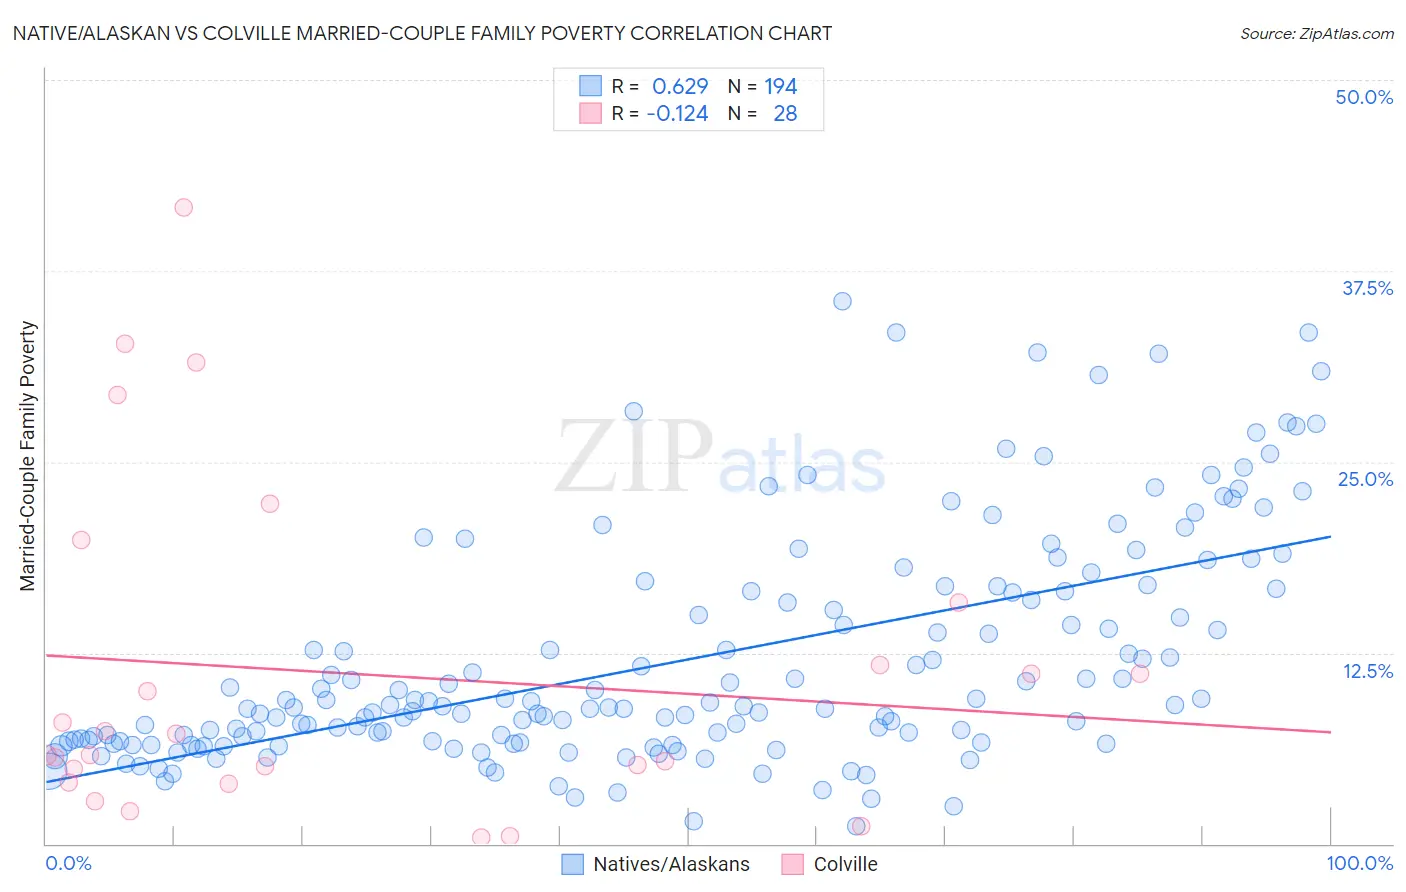
Native/Alaskan vs Colville Married-Couple Family Poverty Correlation Chart
The statistical analysis conducted on geographies consisting of 506,148,611 people shows a significant positive correlation between the proportion of Natives/Alaskans and poverty level among married-couple families in the United States with a correlation coefficient (R) of 0.629 and weighted average of 8.2%. Similarly, the statistical analysis conducted on geographies consisting of 34,633,773 people shows a poor negative correlation between the proportion of Colville and poverty level among married-couple families in the United States with a correlation coefficient (R) of -0.124 and weighted average of 6.3%, a difference of 30.4%.
Married-Couple Family Poverty Correlation Summary
| Measurement | Native/Alaskan | Colville |
| Minimum | 1.1% | 0.42% |
| Maximum | 35.5% | 41.7% |
| Range | 34.4% | 41.2% |
| Mean | 12.0% | 11.2% |
| Median | 9.0% | 6.5% |
| Interquartile 25% (IQ1) | 6.7% | 4.4% |
| Interquartile 75% (IQ3) | 16.5% | 13.7% |
| Interquartile Range (IQR) | 9.9% | 9.3% |
| Standard Deviation (Sample) | 7.4% | 10.9% |
| Standard Deviation (Population) | 7.4% | 10.7% |
Similar Demographics by Married-Couple Family Poverty
Demographics Similar to Natives/Alaskans by Married-Couple Family Poverty
In terms of married-couple family poverty, the demographic groups most similar to Natives/Alaskans are Paiute (8.3%, a difference of 1.3%), Central American Indian (8.3%, a difference of 1.3%), Dominican (8.3%, a difference of 1.4%), Lumbee (8.3%, a difference of 1.9%), and Immigrants from Dominican Republic (8.4%, a difference of 2.5%).
| Demographics | Rating | Rank | Married-Couple Family Poverty |
| Immigrants | Honduras | 0.0 /100 | #322 | Tragic 7.3% |
| Vietnamese | 0.0 /100 | #323 | Tragic 7.4% |
| Immigrants | Central America | 0.0 /100 | #324 | Tragic 7.4% |
| Immigrants | Cuba | 0.0 /100 | #325 | Tragic 7.5% |
| Immigrants | Bangladesh | 0.0 /100 | #326 | Tragic 7.5% |
| Hispanics or Latinos | 0.0 /100 | #327 | Tragic 7.5% |
| Immigrants | Mexico | 0.0 /100 | #328 | Tragic 7.6% |
| Natives/Alaskans | 0.0 /100 | #329 | Tragic 8.2% |
| Paiute | 0.0 /100 | #330 | Tragic 8.3% |
| Central American Indians | 0.0 /100 | #331 | Tragic 8.3% |
| Dominicans | 0.0 /100 | #332 | Tragic 8.3% |
| Lumbee | 0.0 /100 | #333 | Tragic 8.3% |
| Immigrants | Dominican Republic | 0.0 /100 | #334 | Tragic 8.4% |
| Sioux | 0.0 /100 | #335 | Tragic 8.7% |
| Apache | 0.0 /100 | #336 | Tragic 9.0% |
Demographics Similar to Colville by Married-Couple Family Poverty
In terms of married-couple family poverty, the demographic groups most similar to Colville are Barbadian (6.3%, a difference of 0.050%), Choctaw (6.3%, a difference of 0.21%), Yaqui (6.3%, a difference of 0.66%), Trinidadian and Tobagonian (6.2%, a difference of 0.78%), and Indonesian (6.3%, a difference of 0.80%).
| Demographics | Rating | Rank | Married-Couple Family Poverty |
| Creek | 0.2 /100 | #266 | Tragic 6.2% |
| Spanish Americans | 0.2 /100 | #267 | Tragic 6.2% |
| Alaska Natives | 0.2 /100 | #268 | Tragic 6.2% |
| Immigrants | West Indies | 0.1 /100 | #269 | Tragic 6.2% |
| Immigrants | Jamaica | 0.1 /100 | #270 | Tragic 6.2% |
| Immigrants | Bahamas | 0.1 /100 | #271 | Tragic 6.2% |
| Trinidadians and Tobagonians | 0.1 /100 | #272 | Tragic 6.2% |
| Colville | 0.1 /100 | #273 | Tragic 6.3% |
| Barbadians | 0.1 /100 | #274 | Tragic 6.3% |
| Choctaw | 0.1 /100 | #275 | Tragic 6.3% |
| Yaqui | 0.1 /100 | #276 | Tragic 6.3% |
| Indonesians | 0.1 /100 | #277 | Tragic 6.3% |
| Immigrants | Trinidad and Tobago | 0.1 /100 | #278 | Tragic 6.4% |
| Houma | 0.0 /100 | #279 | Tragic 6.4% |
| West Indians | 0.0 /100 | #280 | Tragic 6.4% |