Yugoslavian vs Subsaharan African Female Poverty
COMPARE
Yugoslavian
Subsaharan African
Female Poverty
Female Poverty Comparison
Yugoslavians
Sub-Saharan Africans
13.1%
FEMALE POVERTY
76.9/ 100
METRIC RATING
148th/ 347
METRIC RANK
15.8%
FEMALE POVERTY
0.1/ 100
METRIC RATING
267th/ 347
METRIC RANK
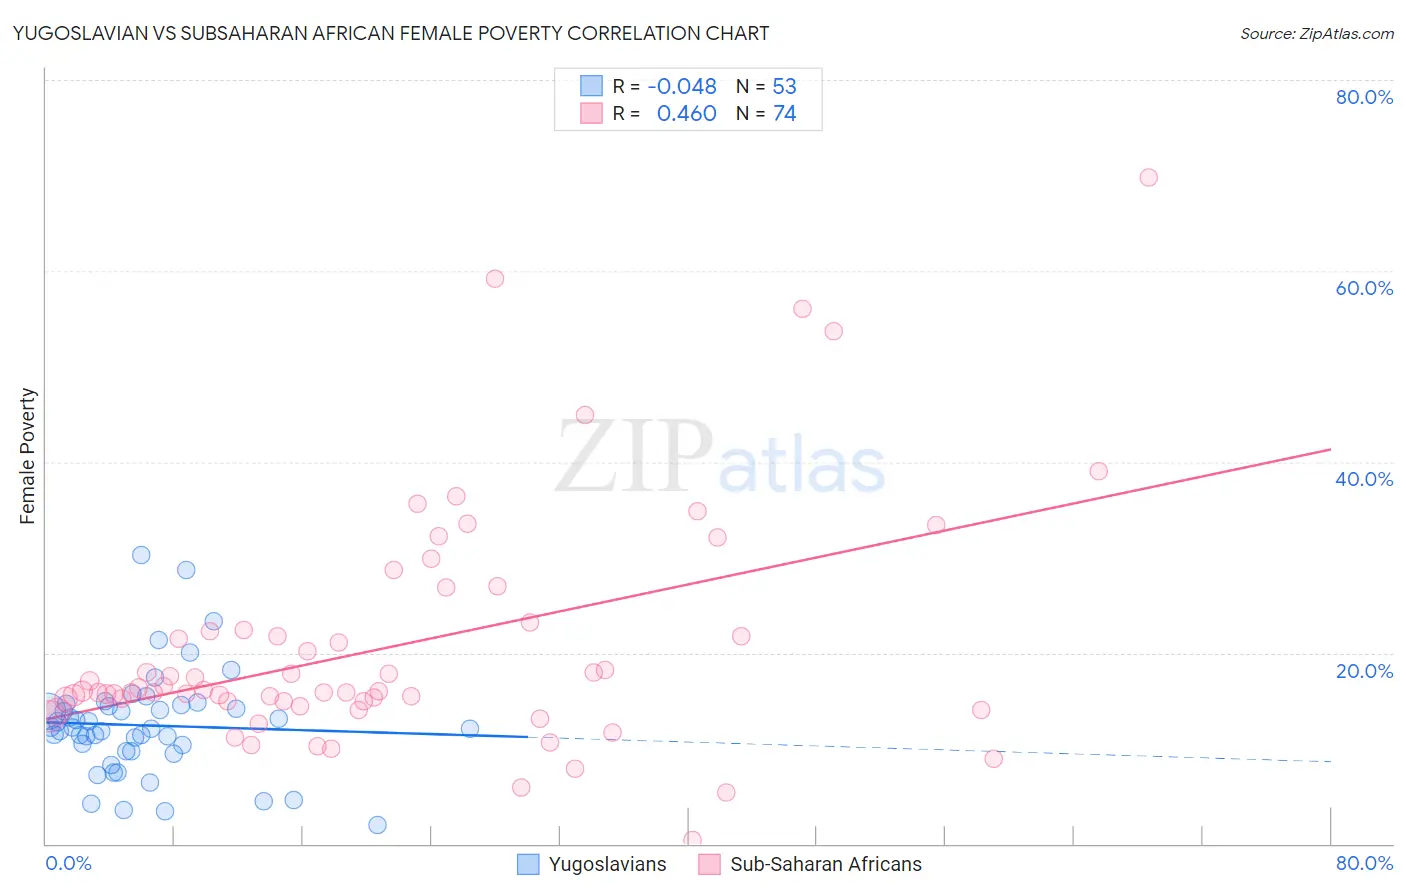
Yugoslavian vs Subsaharan African Female Poverty Correlation Chart
The statistical analysis conducted on geographies consisting of 285,591,967 people shows no correlation between the proportion of Yugoslavians and poverty level among females in the United States with a correlation coefficient (R) of -0.048 and weighted average of 13.1%. Similarly, the statistical analysis conducted on geographies consisting of 507,469,907 people shows a moderate positive correlation between the proportion of Sub-Saharan Africans and poverty level among females in the United States with a correlation coefficient (R) of 0.460 and weighted average of 15.8%, a difference of 20.7%.
Female Poverty Correlation Summary
| Measurement | Yugoslavian | Subsaharan African |
| Minimum | 2.0% | 0.38% |
| Maximum | 30.2% | 69.8% |
| Range | 28.2% | 69.4% |
| Mean | 12.4% | 20.8% |
| Median | 12.1% | 16.0% |
| Interquartile 25% (IQ1) | 9.7% | 14.9% |
| Interquartile 75% (IQ3) | 14.5% | 22.4% |
| Interquartile Range (IQR) | 4.8% | 7.5% |
| Standard Deviation (Sample) | 5.5% | 12.5% |
| Standard Deviation (Population) | 5.5% | 12.4% |
Similar Demographics by Female Poverty
Demographics Similar to Yugoslavians by Female Poverty
In terms of female poverty, the demographic groups most similar to Yugoslavians are Taiwanese (13.1%, a difference of 0.16%), Tsimshian (13.1%, a difference of 0.19%), Immigrants from Kazakhstan (13.0%, a difference of 0.25%), Immigrants from Germany (13.1%, a difference of 0.26%), and Immigrants from Peru (13.0%, a difference of 0.33%).
| Demographics | Rating | Rank | Female Poverty |
| Icelanders | 81.1 /100 | #141 | Excellent 13.0% |
| Brazilians | 80.5 /100 | #142 | Excellent 13.0% |
| Immigrants | Malaysia | 80.4 /100 | #143 | Excellent 13.0% |
| Afghans | 79.8 /100 | #144 | Good 13.0% |
| Syrians | 79.6 /100 | #145 | Good 13.0% |
| Immigrants | Peru | 79.1 /100 | #146 | Good 13.0% |
| Immigrants | Kazakhstan | 78.6 /100 | #147 | Good 13.0% |
| Yugoslavians | 76.9 /100 | #148 | Good 13.1% |
| Taiwanese | 75.7 /100 | #149 | Good 13.1% |
| Tsimshian | 75.5 /100 | #150 | Good 13.1% |
| Immigrants | Germany | 74.9 /100 | #151 | Good 13.1% |
| Samoans | 73.6 /100 | #152 | Good 13.1% |
| Immigrants | Fiji | 71.0 /100 | #153 | Good 13.2% |
| Armenians | 70.4 /100 | #154 | Good 13.2% |
| Hungarians | 70.1 /100 | #155 | Good 13.2% |
Demographics Similar to Sub-Saharan Africans by Female Poverty
In terms of female poverty, the demographic groups most similar to Sub-Saharan Africans are Immigrants from Nicaragua (15.8%, a difference of 0.060%), Immigrants from El Salvador (15.7%, a difference of 0.43%), Iroquois (15.8%, a difference of 0.43%), Immigrants from Liberia (15.7%, a difference of 0.49%), and Chickasaw (15.9%, a difference of 0.69%).
| Demographics | Rating | Rank | Female Poverty |
| Immigrants | Guyana | 0.1 /100 | #260 | Tragic 15.6% |
| Guyanese | 0.1 /100 | #261 | Tragic 15.6% |
| Mexican American Indians | 0.1 /100 | #262 | Tragic 15.6% |
| Cherokee | 0.1 /100 | #263 | Tragic 15.6% |
| Immigrants | Ecuador | 0.1 /100 | #264 | Tragic 15.6% |
| Immigrants | Liberia | 0.1 /100 | #265 | Tragic 15.7% |
| Immigrants | El Salvador | 0.1 /100 | #266 | Tragic 15.7% |
| Sub-Saharan Africans | 0.1 /100 | #267 | Tragic 15.8% |
| Immigrants | Nicaragua | 0.1 /100 | #268 | Tragic 15.8% |
| Iroquois | 0.1 /100 | #269 | Tragic 15.8% |
| Chickasaw | 0.1 /100 | #270 | Tragic 15.9% |
| Immigrants | St. Vincent and the Grenadines | 0.0 /100 | #271 | Tragic 15.9% |
| Belizeans | 0.0 /100 | #272 | Tragic 15.9% |
| Haitians | 0.0 /100 | #273 | Tragic 15.9% |
| Barbadians | 0.0 /100 | #274 | Tragic 15.9% |