Yugoslavian vs Subsaharan African Median Household Income
COMPARE
Yugoslavian
Subsaharan African
Median Household Income
Median Household Income Comparison
Yugoslavians
Sub-Saharan Africans
$82,186
MEDIAN HOUSEHOLD INCOME
13.3/ 100
METRIC RATING
216th/ 347
METRIC RANK
$77,631
MEDIAN HOUSEHOLD INCOME
0.8/ 100
METRIC RATING
254th/ 347
METRIC RANK
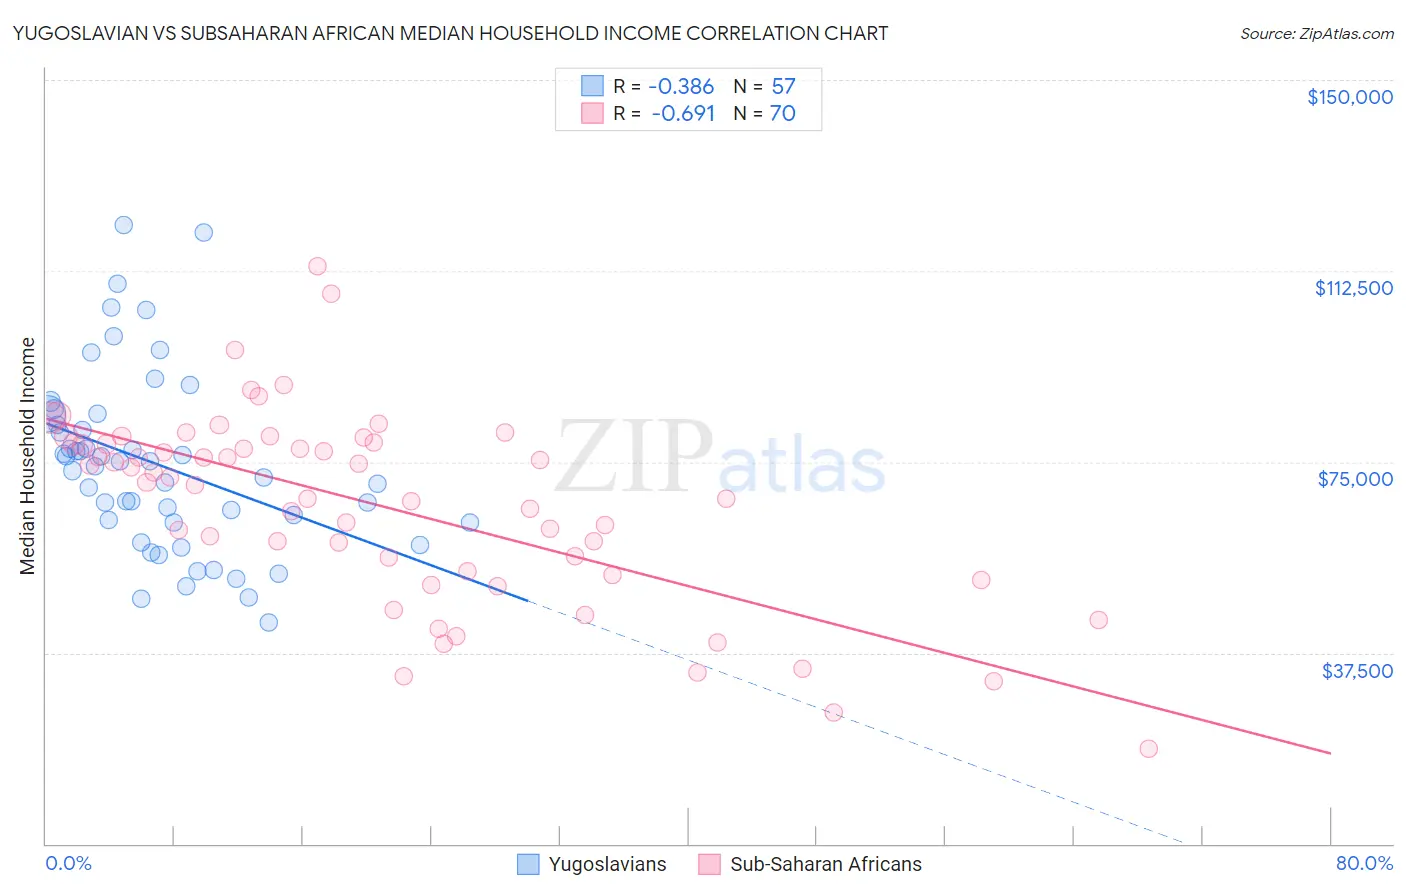
Yugoslavian vs Subsaharan African Median Household Income Correlation Chart
The statistical analysis conducted on geographies consisting of 285,592,338 people shows a mild negative correlation between the proportion of Yugoslavians and median household income in the United States with a correlation coefficient (R) of -0.386 and weighted average of $82,186. Similarly, the statistical analysis conducted on geographies consisting of 507,380,534 people shows a significant negative correlation between the proportion of Sub-Saharan Africans and median household income in the United States with a correlation coefficient (R) of -0.691 and weighted average of $77,631, a difference of 5.9%.
Median Household Income Correlation Summary
| Measurement | Yugoslavian | Subsaharan African |
| Minimum | $43,409 | $18,750 |
| Maximum | $121,486 | $113,418 |
| Range | $78,077 | $94,668 |
| Mean | $74,414 | $66,483 |
| Median | $74,058 | $71,386 |
| Interquartile 25% (IQ1) | $63,141 | $53,589 |
| Interquartile 75% (IQ3) | $83,356 | $78,576 |
| Interquartile Range (IQR) | $20,215 | $24,988 |
| Standard Deviation (Sample) | $17,545 | $18,848 |
| Standard Deviation (Population) | $17,391 | $18,713 |
Similar Demographics by Median Household Income
Demographics Similar to Yugoslavians by Median Household Income
In terms of median household income, the demographic groups most similar to Yugoslavians are Vietnamese ($82,248, a difference of 0.070%), Panamanian ($82,272, a difference of 0.10%), Ecuadorian ($82,070, a difference of 0.14%), White/Caucasian ($82,029, a difference of 0.19%), and Nepalese ($82,410, a difference of 0.27%).
| Demographics | Rating | Rank | Median Household Income |
| Immigrants | Iraq | 16.7 /100 | #209 | Poor $82,594 |
| Immigrants | Uruguay | 16.4 /100 | #210 | Poor $82,560 |
| Salvadorans | 15.4 /100 | #211 | Poor $82,449 |
| Venezuelans | 15.3 /100 | #212 | Poor $82,432 |
| Nepalese | 15.1 /100 | #213 | Poor $82,410 |
| Panamanians | 14.0 /100 | #214 | Poor $82,272 |
| Vietnamese | 13.8 /100 | #215 | Poor $82,248 |
| Yugoslavians | 13.3 /100 | #216 | Poor $82,186 |
| Ecuadorians | 12.5 /100 | #217 | Poor $82,070 |
| Whites/Caucasians | 12.2 /100 | #218 | Poor $82,029 |
| Nigerians | 10.3 /100 | #219 | Poor $81,725 |
| Immigrants | Venezuela | 9.0 /100 | #220 | Tragic $81,506 |
| Immigrants | Ghana | 9.0 /100 | #221 | Tragic $81,489 |
| Immigrants | Nigeria | 7.7 /100 | #222 | Tragic $81,236 |
| Immigrants | El Salvador | 7.6 /100 | #223 | Tragic $81,213 |
Demographics Similar to Sub-Saharan Africans by Median Household Income
In terms of median household income, the demographic groups most similar to Sub-Saharan Africans are Immigrants from St. Vincent and the Grenadines ($77,690, a difference of 0.080%), Immigrants from Middle Africa ($77,559, a difference of 0.090%), Immigrants from West Indies ($77,956, a difference of 0.42%), Mexican American Indian ($78,166, a difference of 0.69%), and Belizean ($77,028, a difference of 0.78%).
| Demographics | Rating | Rank | Median Household Income |
| Immigrants | Burma/Myanmar | 1.6 /100 | #247 | Tragic $78,682 |
| Sudanese | 1.5 /100 | #248 | Tragic $78,529 |
| West Indians | 1.4 /100 | #249 | Tragic $78,455 |
| Immigrants | Laos | 1.3 /100 | #250 | Tragic $78,327 |
| Mexican American Indians | 1.2 /100 | #251 | Tragic $78,166 |
| Immigrants | West Indies | 1.0 /100 | #252 | Tragic $77,956 |
| Immigrants | St. Vincent and the Grenadines | 0.9 /100 | #253 | Tragic $77,690 |
| Sub-Saharan Africans | 0.8 /100 | #254 | Tragic $77,631 |
| Immigrants | Middle Africa | 0.8 /100 | #255 | Tragic $77,559 |
| Belizeans | 0.6 /100 | #256 | Tragic $77,028 |
| Immigrants | Senegal | 0.5 /100 | #257 | Tragic $76,915 |
| Immigrants | Nicaragua | 0.5 /100 | #258 | Tragic $76,784 |
| Spanish American Indians | 0.4 /100 | #259 | Tragic $76,670 |
| Jamaicans | 0.4 /100 | #260 | Tragic $76,583 |
| Immigrants | Grenada | 0.4 /100 | #261 | Tragic $76,517 |