Yugoslavian vs Immigrants from Moldova Female Poverty
COMPARE
Yugoslavian
Immigrants from Moldova
Female Poverty
Female Poverty Comparison
Yugoslavians
Immigrants from Moldova
13.1%
FEMALE POVERTY
76.9/ 100
METRIC RATING
148th/ 347
METRIC RANK
11.9%
FEMALE POVERTY
99.2/ 100
METRIC RATING
42nd/ 347
METRIC RANK
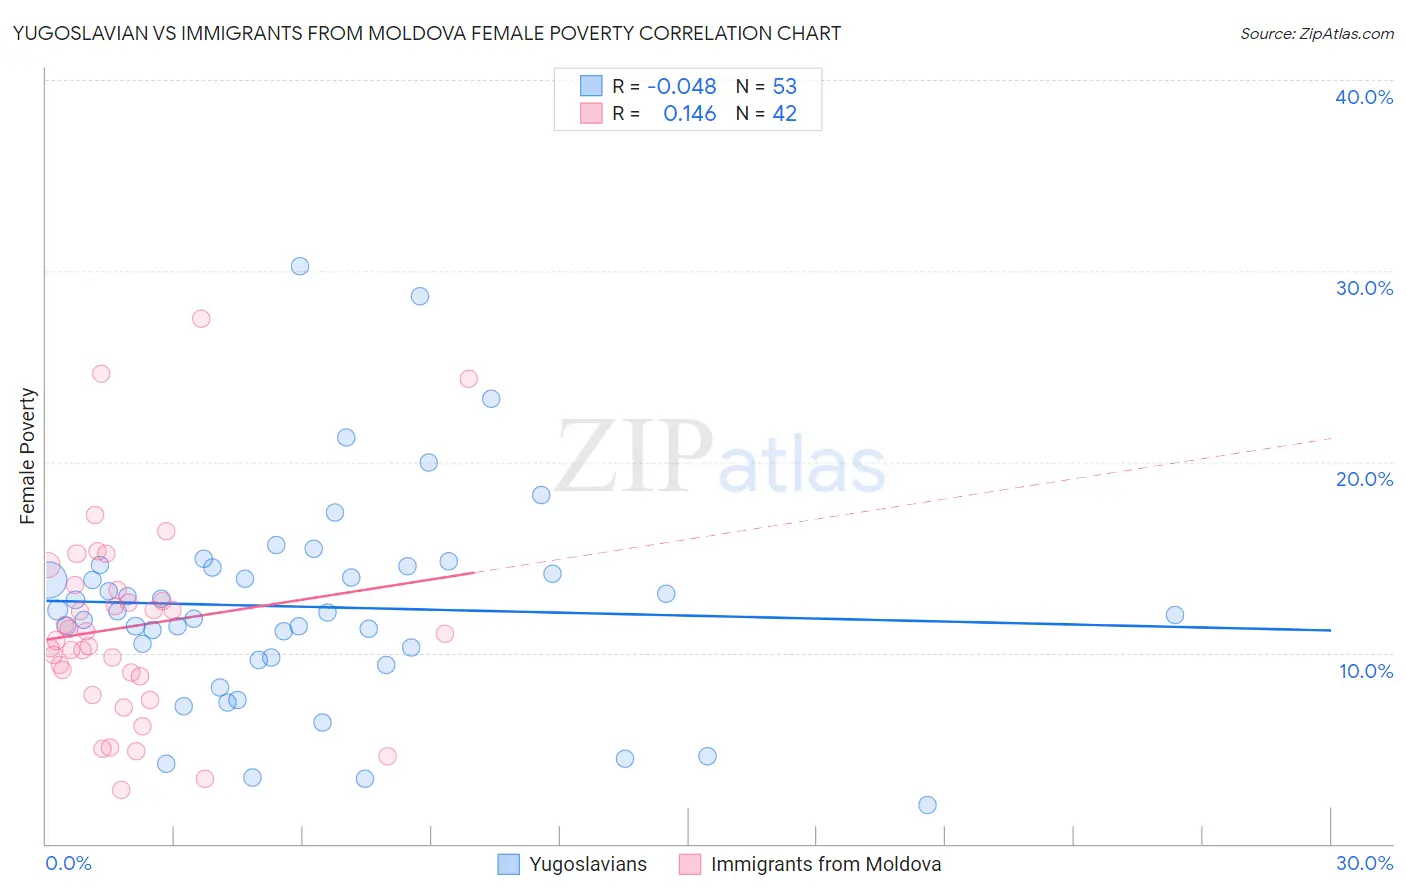
Yugoslavian vs Immigrants from Moldova Female Poverty Correlation Chart
The statistical analysis conducted on geographies consisting of 285,591,967 people shows no correlation between the proportion of Yugoslavians and poverty level among females in the United States with a correlation coefficient (R) of -0.048 and weighted average of 13.1%. Similarly, the statistical analysis conducted on geographies consisting of 124,368,843 people shows a poor positive correlation between the proportion of Immigrants from Moldova and poverty level among females in the United States with a correlation coefficient (R) of 0.146 and weighted average of 11.9%, a difference of 10.0%.
Female Poverty Correlation Summary
| Measurement | Yugoslavian | Immigrants from Moldova |
| Minimum | 2.0% | 2.8% |
| Maximum | 30.2% | 27.5% |
| Range | 28.2% | 24.7% |
| Mean | 12.4% | 11.4% |
| Median | 12.1% | 10.8% |
| Interquartile 25% (IQ1) | 9.7% | 8.7% |
| Interquartile 75% (IQ3) | 14.5% | 13.3% |
| Interquartile Range (IQR) | 4.8% | 4.6% |
| Standard Deviation (Sample) | 5.5% | 5.3% |
| Standard Deviation (Population) | 5.5% | 5.2% |
Similar Demographics by Female Poverty
Demographics Similar to Yugoslavians by Female Poverty
In terms of female poverty, the demographic groups most similar to Yugoslavians are Taiwanese (13.1%, a difference of 0.16%), Tsimshian (13.1%, a difference of 0.19%), Immigrants from Kazakhstan (13.0%, a difference of 0.25%), Immigrants from Germany (13.1%, a difference of 0.26%), and Immigrants from Peru (13.0%, a difference of 0.33%).
| Demographics | Rating | Rank | Female Poverty |
| Icelanders | 81.1 /100 | #141 | Excellent 13.0% |
| Brazilians | 80.5 /100 | #142 | Excellent 13.0% |
| Immigrants | Malaysia | 80.4 /100 | #143 | Excellent 13.0% |
| Afghans | 79.8 /100 | #144 | Good 13.0% |
| Syrians | 79.6 /100 | #145 | Good 13.0% |
| Immigrants | Peru | 79.1 /100 | #146 | Good 13.0% |
| Immigrants | Kazakhstan | 78.6 /100 | #147 | Good 13.0% |
| Yugoslavians | 76.9 /100 | #148 | Good 13.1% |
| Taiwanese | 75.7 /100 | #149 | Good 13.1% |
| Tsimshian | 75.5 /100 | #150 | Good 13.1% |
| Immigrants | Germany | 74.9 /100 | #151 | Good 13.1% |
| Samoans | 73.6 /100 | #152 | Good 13.1% |
| Immigrants | Fiji | 71.0 /100 | #153 | Good 13.2% |
| Armenians | 70.4 /100 | #154 | Good 13.2% |
| Hungarians | 70.1 /100 | #155 | Good 13.2% |
Demographics Similar to Immigrants from Moldova by Female Poverty
In terms of female poverty, the demographic groups most similar to Immigrants from Moldova are Czech (11.9%, a difference of 0.0%), Korean (11.9%, a difference of 0.040%), Tongan (11.9%, a difference of 0.11%), Macedonian (11.8%, a difference of 0.18%), and Immigrants from Czechoslovakia (11.9%, a difference of 0.20%).
| Demographics | Rating | Rank | Female Poverty |
| Immigrants | Iran | 99.4 /100 | #35 | Exceptional 11.8% |
| Immigrants | Pakistan | 99.4 /100 | #36 | Exceptional 11.8% |
| Immigrants | Greece | 99.3 /100 | #37 | Exceptional 11.8% |
| Russians | 99.3 /100 | #38 | Exceptional 11.8% |
| Immigrants | Poland | 99.3 /100 | #39 | Exceptional 11.8% |
| Macedonians | 99.3 /100 | #40 | Exceptional 11.8% |
| Czechs | 99.2 /100 | #41 | Exceptional 11.9% |
| Immigrants | Moldova | 99.2 /100 | #42 | Exceptional 11.9% |
| Koreans | 99.2 /100 | #43 | Exceptional 11.9% |
| Tongans | 99.2 /100 | #44 | Exceptional 11.9% |
| Immigrants | Czechoslovakia | 99.2 /100 | #45 | Exceptional 11.9% |
| Turks | 99.2 /100 | #46 | Exceptional 11.9% |
| Asians | 99.1 /100 | #47 | Exceptional 11.9% |
| Immigrants | Japan | 99.0 /100 | #48 | Exceptional 11.9% |
| Immigrants | Romania | 99.0 /100 | #49 | Exceptional 12.0% |