Yugoslavian vs Ecuadorian Female Poverty
COMPARE
Yugoslavian
Ecuadorian
Female Poverty
Female Poverty Comparison
Yugoslavians
Ecuadorians
13.1%
FEMALE POVERTY
76.9/ 100
METRIC RATING
148th/ 347
METRIC RANK
15.3%
FEMALE POVERTY
0.3/ 100
METRIC RATING
244th/ 347
METRIC RANK
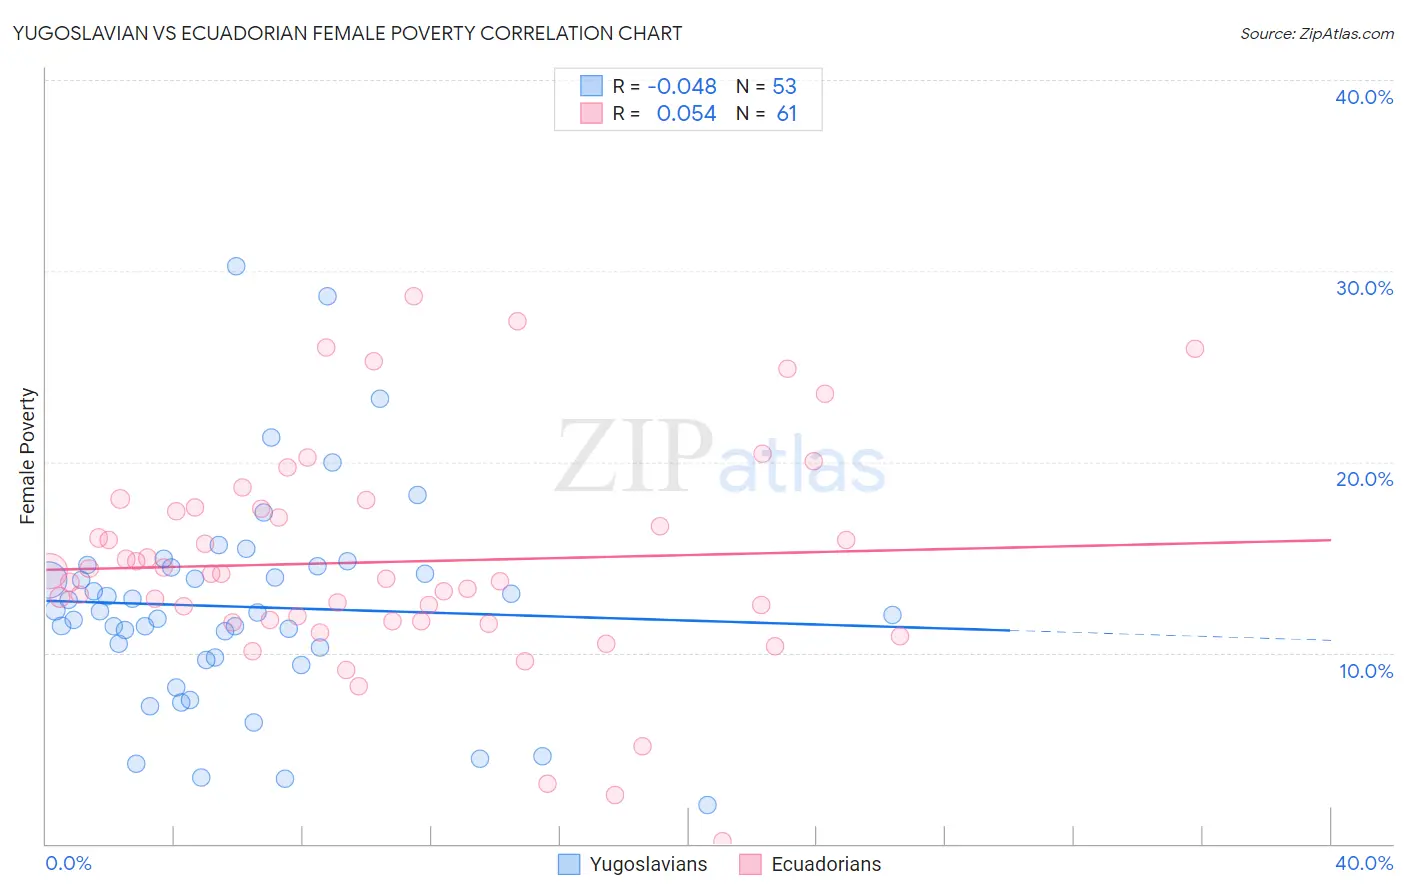
Yugoslavian vs Ecuadorian Female Poverty Correlation Chart
The statistical analysis conducted on geographies consisting of 285,591,967 people shows no correlation between the proportion of Yugoslavians and poverty level among females in the United States with a correlation coefficient (R) of -0.048 and weighted average of 13.1%. Similarly, the statistical analysis conducted on geographies consisting of 317,585,196 people shows a slight positive correlation between the proportion of Ecuadorians and poverty level among females in the United States with a correlation coefficient (R) of 0.054 and weighted average of 15.3%, a difference of 17.1%.
Female Poverty Correlation Summary
| Measurement | Yugoslavian | Ecuadorian |
| Minimum | 2.0% | 0.14% |
| Maximum | 30.2% | 28.7% |
| Range | 28.2% | 28.5% |
| Mean | 12.4% | 14.8% |
| Median | 12.1% | 14.1% |
| Interquartile 25% (IQ1) | 9.7% | 11.7% |
| Interquartile 75% (IQ3) | 14.5% | 17.6% |
| Interquartile Range (IQR) | 4.8% | 5.9% |
| Standard Deviation (Sample) | 5.5% | 5.7% |
| Standard Deviation (Population) | 5.5% | 5.7% |
Similar Demographics by Female Poverty
Demographics Similar to Yugoslavians by Female Poverty
In terms of female poverty, the demographic groups most similar to Yugoslavians are Taiwanese (13.1%, a difference of 0.16%), Tsimshian (13.1%, a difference of 0.19%), Immigrants from Kazakhstan (13.0%, a difference of 0.25%), Immigrants from Germany (13.1%, a difference of 0.26%), and Immigrants from Peru (13.0%, a difference of 0.33%).
| Demographics | Rating | Rank | Female Poverty |
| Icelanders | 81.1 /100 | #141 | Excellent 13.0% |
| Brazilians | 80.5 /100 | #142 | Excellent 13.0% |
| Immigrants | Malaysia | 80.4 /100 | #143 | Excellent 13.0% |
| Afghans | 79.8 /100 | #144 | Good 13.0% |
| Syrians | 79.6 /100 | #145 | Good 13.0% |
| Immigrants | Peru | 79.1 /100 | #146 | Good 13.0% |
| Immigrants | Kazakhstan | 78.6 /100 | #147 | Good 13.0% |
| Yugoslavians | 76.9 /100 | #148 | Good 13.1% |
| Taiwanese | 75.7 /100 | #149 | Good 13.1% |
| Tsimshian | 75.5 /100 | #150 | Good 13.1% |
| Immigrants | Germany | 74.9 /100 | #151 | Good 13.1% |
| Samoans | 73.6 /100 | #152 | Good 13.1% |
| Immigrants | Fiji | 71.0 /100 | #153 | Good 13.2% |
| Armenians | 70.4 /100 | #154 | Good 13.2% |
| Hungarians | 70.1 /100 | #155 | Good 13.2% |
Demographics Similar to Ecuadorians by Female Poverty
In terms of female poverty, the demographic groups most similar to Ecuadorians are Nicaraguan (15.3%, a difference of 0.050%), Spanish American Indian (15.3%, a difference of 0.090%), Cuban (15.3%, a difference of 0.15%), Potawatomi (15.3%, a difference of 0.16%), and Immigrants from Ghana (15.3%, a difference of 0.16%).
| Demographics | Rating | Rank | Female Poverty |
| French American Indians | 0.6 /100 | #237 | Tragic 15.1% |
| Immigrants | Armenia | 0.6 /100 | #238 | Tragic 15.1% |
| Immigrants | Middle Africa | 0.5 /100 | #239 | Tragic 15.2% |
| Sudanese | 0.5 /100 | #240 | Tragic 15.2% |
| Immigrants | Sudan | 0.4 /100 | #241 | Tragic 15.2% |
| Nepalese | 0.4 /100 | #242 | Tragic 15.2% |
| Nicaraguans | 0.3 /100 | #243 | Tragic 15.3% |
| Ecuadorians | 0.3 /100 | #244 | Tragic 15.3% |
| Spanish American Indians | 0.3 /100 | #245 | Tragic 15.3% |
| Cubans | 0.3 /100 | #246 | Tragic 15.3% |
| Potawatomi | 0.3 /100 | #247 | Tragic 15.3% |
| Immigrants | Ghana | 0.3 /100 | #248 | Tragic 15.3% |
| Salvadorans | 0.3 /100 | #249 | Tragic 15.3% |
| Immigrants | Western Africa | 0.3 /100 | #250 | Tragic 15.3% |
| Immigrants | Trinidad and Tobago | 0.3 /100 | #251 | Tragic 15.4% |