Yugoslavian vs Immigrants from Peru Female Poverty
COMPARE
Yugoslavian
Immigrants from Peru
Female Poverty
Female Poverty Comparison
Yugoslavians
Immigrants from Peru
13.1%
FEMALE POVERTY
76.9/ 100
METRIC RATING
148th/ 347
METRIC RANK
13.0%
FEMALE POVERTY
79.1/ 100
METRIC RATING
146th/ 347
METRIC RANK
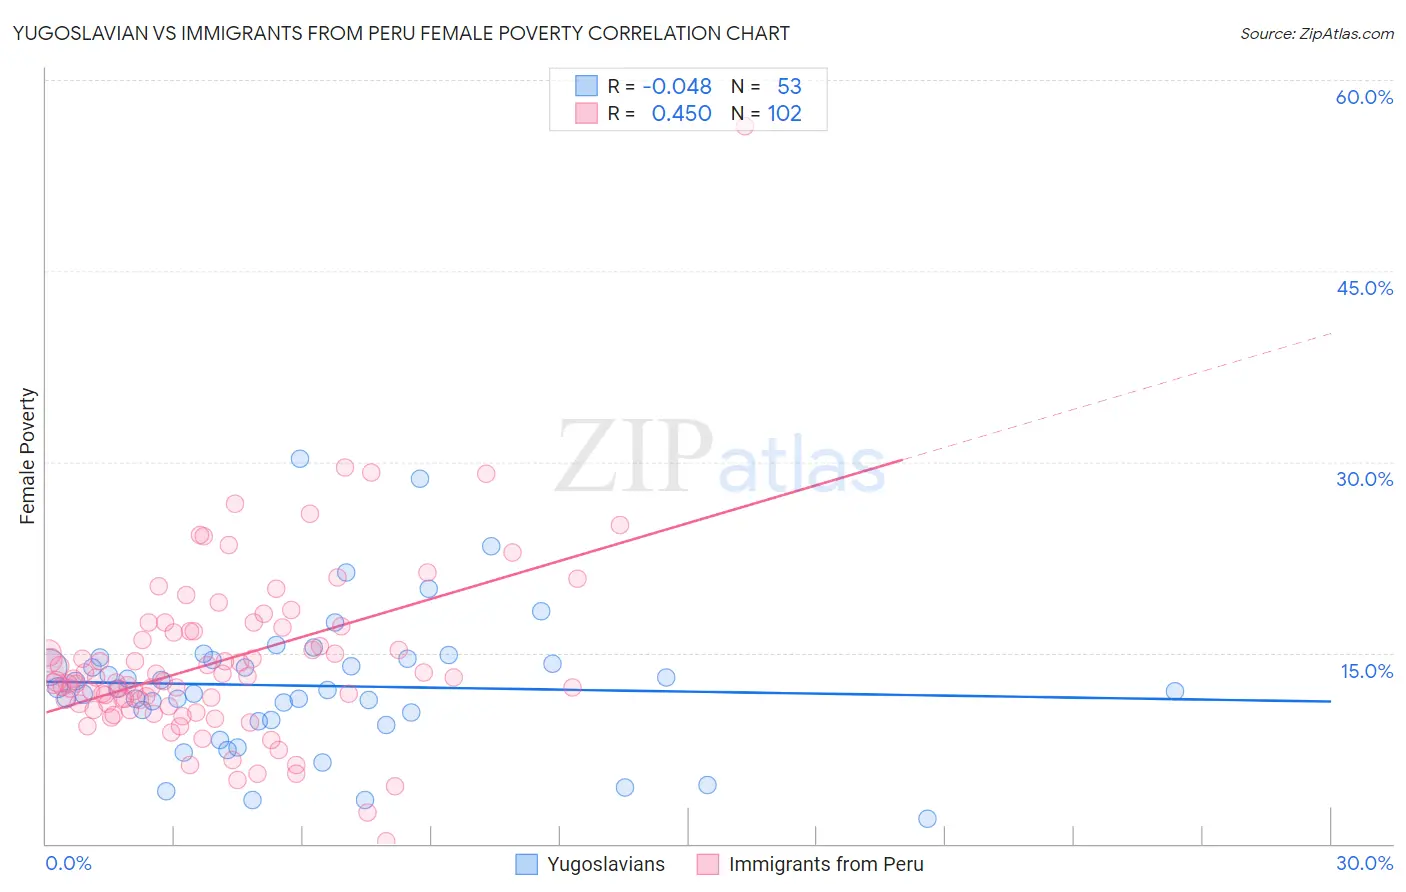
Yugoslavian vs Immigrants from Peru Female Poverty Correlation Chart
The statistical analysis conducted on geographies consisting of 285,591,967 people shows no correlation between the proportion of Yugoslavians and poverty level among females in the United States with a correlation coefficient (R) of -0.048 and weighted average of 13.1%. Similarly, the statistical analysis conducted on geographies consisting of 328,728,905 people shows a moderate positive correlation between the proportion of Immigrants from Peru and poverty level among females in the United States with a correlation coefficient (R) of 0.450 and weighted average of 13.0%, a difference of 0.33%.
Female Poverty Correlation Summary
| Measurement | Yugoslavian | Immigrants from Peru |
| Minimum | 2.0% | 0.21% |
| Maximum | 30.2% | 56.3% |
| Range | 28.2% | 56.1% |
| Mean | 12.4% | 14.4% |
| Median | 12.1% | 12.8% |
| Interquartile 25% (IQ1) | 9.7% | 11.0% |
| Interquartile 75% (IQ3) | 14.5% | 16.7% |
| Interquartile Range (IQR) | 4.8% | 5.7% |
| Standard Deviation (Sample) | 5.5% | 7.0% |
| Standard Deviation (Population) | 5.5% | 7.0% |
Demographics Similar to Yugoslavians and Immigrants from Peru by Female Poverty
In terms of female poverty, the demographic groups most similar to Yugoslavians are Taiwanese (13.1%, a difference of 0.16%), Tsimshian (13.1%, a difference of 0.19%), Immigrants from Kazakhstan (13.0%, a difference of 0.25%), Immigrants from Germany (13.1%, a difference of 0.26%), and Syrian (13.0%, a difference of 0.40%). Similarly, the demographic groups most similar to Immigrants from Peru are Syrian (13.0%, a difference of 0.080%), Immigrants from Kazakhstan (13.0%, a difference of 0.080%), Afghan (13.0%, a difference of 0.11%), Immigrants from Malaysia (13.0%, a difference of 0.19%), and Brazilian (13.0%, a difference of 0.22%).
| Demographics | Rating | Rank | Female Poverty |
| Chileans | 84.7 /100 | #137 | Excellent 12.9% |
| Immigrants | France | 83.6 /100 | #138 | Excellent 12.9% |
| Basques | 83.1 /100 | #139 | Excellent 12.9% |
| Pakistanis | 83.0 /100 | #140 | Excellent 12.9% |
| Icelanders | 81.1 /100 | #141 | Excellent 13.0% |
| Brazilians | 80.5 /100 | #142 | Excellent 13.0% |
| Immigrants | Malaysia | 80.4 /100 | #143 | Excellent 13.0% |
| Afghans | 79.8 /100 | #144 | Good 13.0% |
| Syrians | 79.6 /100 | #145 | Good 13.0% |
| Immigrants | Peru | 79.1 /100 | #146 | Good 13.0% |
| Immigrants | Kazakhstan | 78.6 /100 | #147 | Good 13.0% |
| Yugoslavians | 76.9 /100 | #148 | Good 13.1% |
| Taiwanese | 75.7 /100 | #149 | Good 13.1% |
| Tsimshian | 75.5 /100 | #150 | Good 13.1% |
| Immigrants | Germany | 74.9 /100 | #151 | Good 13.1% |
| Samoans | 73.6 /100 | #152 | Good 13.1% |
| Immigrants | Fiji | 71.0 /100 | #153 | Good 13.2% |
| Armenians | 70.4 /100 | #154 | Good 13.2% |
| Hungarians | 70.1 /100 | #155 | Good 13.2% |
| Immigrants | Bosnia and Herzegovina | 69.7 /100 | #156 | Good 13.2% |
| Immigrants | Northern Africa | 68.8 /100 | #157 | Good 13.2% |