Kiowa vs Sioux Married-Couple Family Poverty
COMPARE
Kiowa
Sioux
Married-Couple Family Poverty
Married-Couple Family Poverty Comparison
Kiowa
Sioux
6.6%
MARRIED-COUPLE FAMILY POVERTY
0.0/ 100
METRIC RATING
297th/ 347
METRIC RANK
8.7%
MARRIED-COUPLE FAMILY POVERTY
0.0/ 100
METRIC RATING
335th/ 347
METRIC RANK
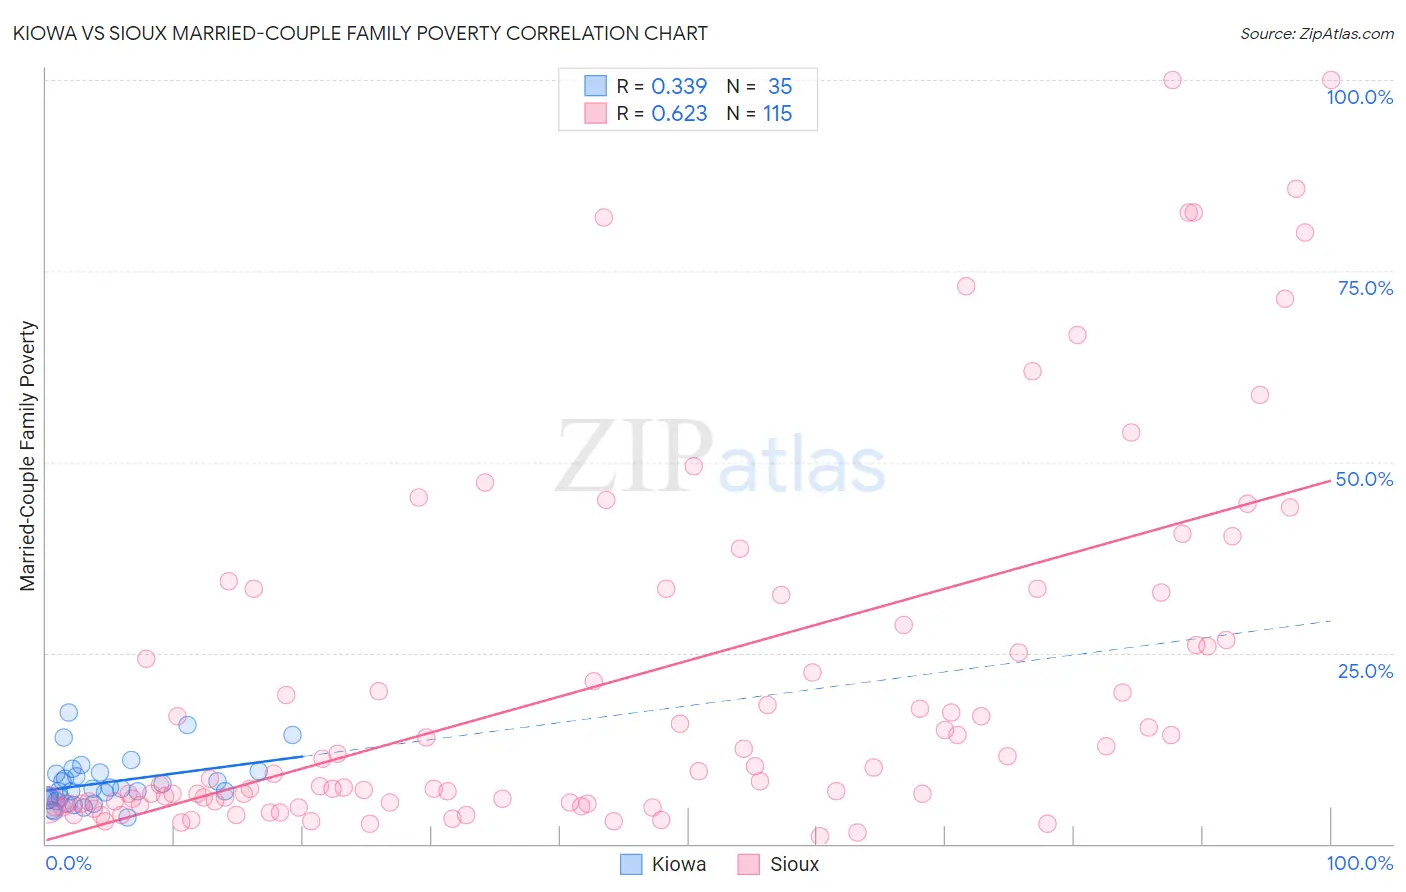
Kiowa vs Sioux Married-Couple Family Poverty Correlation Chart
The statistical analysis conducted on geographies consisting of 56,003,088 people shows a mild positive correlation between the proportion of Kiowa and poverty level among married-couple families in the United States with a correlation coefficient (R) of 0.339 and weighted average of 6.6%. Similarly, the statistical analysis conducted on geographies consisting of 232,751,965 people shows a significant positive correlation between the proportion of Sioux and poverty level among married-couple families in the United States with a correlation coefficient (R) of 0.623 and weighted average of 8.7%, a difference of 30.8%.
Married-Couple Family Poverty Correlation Summary
| Measurement | Kiowa | Sioux |
| Minimum | 3.4% | 0.94% |
| Maximum | 17.1% | 100.0% |
| Range | 13.7% | 99.1% |
| Mean | 8.0% | 21.0% |
| Median | 7.1% | 9.4% |
| Interquartile 25% (IQ1) | 5.8% | 5.3% |
| Interquartile 75% (IQ3) | 9.4% | 28.6% |
| Interquartile Range (IQR) | 3.6% | 23.3% |
| Standard Deviation (Sample) | 3.2% | 23.8% |
| Standard Deviation (Population) | 3.2% | 23.7% |
Similar Demographics by Married-Couple Family Poverty
Demographics Similar to Kiowa by Married-Couple Family Poverty
In terms of married-couple family poverty, the demographic groups most similar to Kiowa are U.S. Virgin Islander (6.6%, a difference of 0.010%), Immigrants from Guyana (6.7%, a difference of 0.070%), Immigrants from Uzbekistan (6.6%, a difference of 0.11%), Bahamian (6.6%, a difference of 0.40%), and Nicaraguan (6.7%, a difference of 0.61%).
| Demographics | Rating | Rank | Married-Couple Family Poverty |
| Immigrants | Barbados | 0.0 /100 | #290 | Tragic 6.5% |
| Belizeans | 0.0 /100 | #291 | Tragic 6.5% |
| Immigrants | Lebanon | 0.0 /100 | #292 | Tragic 6.6% |
| Arapaho | 0.0 /100 | #293 | Tragic 6.6% |
| Bahamians | 0.0 /100 | #294 | Tragic 6.6% |
| Immigrants | Uzbekistan | 0.0 /100 | #295 | Tragic 6.6% |
| U.S. Virgin Islanders | 0.0 /100 | #296 | Tragic 6.6% |
| Kiowa | 0.0 /100 | #297 | Tragic 6.6% |
| Immigrants | Guyana | 0.0 /100 | #298 | Tragic 6.7% |
| Nicaraguans | 0.0 /100 | #299 | Tragic 6.7% |
| Immigrants | Belize | 0.0 /100 | #300 | Tragic 6.7% |
| Central Americans | 0.0 /100 | #301 | Tragic 6.7% |
| Immigrants | Ecuador | 0.0 /100 | #302 | Tragic 6.7% |
| Immigrants | El Salvador | 0.0 /100 | #303 | Tragic 6.8% |
| Cubans | 0.0 /100 | #304 | Tragic 6.8% |
Demographics Similar to Sioux by Married-Couple Family Poverty
In terms of married-couple family poverty, the demographic groups most similar to Sioux are Apache (9.0%, a difference of 2.9%), Yakama (9.0%, a difference of 3.0%), Immigrants from Dominican Republic (8.4%, a difference of 3.6%), Lumbee (8.3%, a difference of 4.3%), and Dominican (8.3%, a difference of 4.8%).
| Demographics | Rating | Rank | Married-Couple Family Poverty |
| Immigrants | Mexico | 0.0 /100 | #328 | Tragic 7.6% |
| Natives/Alaskans | 0.0 /100 | #329 | Tragic 8.2% |
| Paiute | 0.0 /100 | #330 | Tragic 8.3% |
| Central American Indians | 0.0 /100 | #331 | Tragic 8.3% |
| Dominicans | 0.0 /100 | #332 | Tragic 8.3% |
| Lumbee | 0.0 /100 | #333 | Tragic 8.3% |
| Immigrants | Dominican Republic | 0.0 /100 | #334 | Tragic 8.4% |
| Sioux | 0.0 /100 | #335 | Tragic 8.7% |
| Apache | 0.0 /100 | #336 | Tragic 9.0% |
| Yakama | 0.0 /100 | #337 | Tragic 9.0% |
| Cheyenne | 0.0 /100 | #338 | Tragic 9.4% |
| Crow | 0.0 /100 | #339 | Tragic 9.6% |
| Yuman | 0.0 /100 | #340 | Tragic 9.7% |
| Pueblo | 0.0 /100 | #341 | Tragic 11.1% |
| Tohono O'odham | 0.0 /100 | #342 | Tragic 11.2% |