Welsh vs Spanish American Indian In Labor Force | Age 35-44
COMPARE
Welsh
Spanish American Indian
In Labor Force | Age 35-44
In Labor Force | Age 35-44 Comparison
Welsh
Spanish American Indians
84.0%
IN LABOR FORCE | AGE 35-44
5.3/ 100
METRIC RATING
228th/ 347
METRIC RANK
82.5%
IN LABOR FORCE | AGE 35-44
0.0/ 100
METRIC RATING
301st/ 347
METRIC RANK
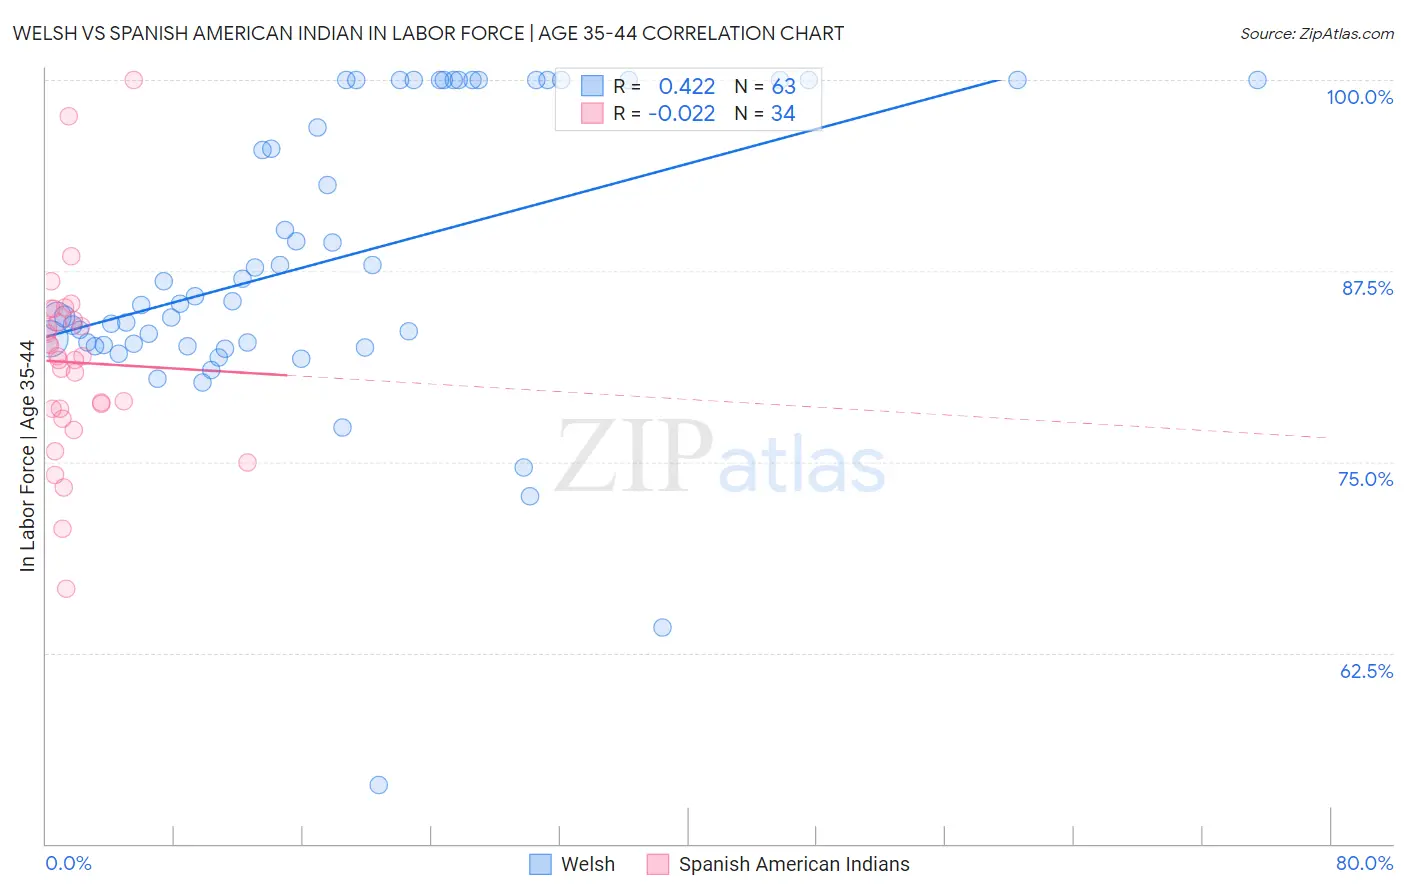
Welsh vs Spanish American Indian In Labor Force | Age 35-44 Correlation Chart
The statistical analysis conducted on geographies consisting of 528,172,849 people shows a moderate positive correlation between the proportion of Welsh and labor force participation rate among population between the ages 35 and 44 in the United States with a correlation coefficient (R) of 0.422 and weighted average of 84.0%. Similarly, the statistical analysis conducted on geographies consisting of 73,144,470 people shows no correlation between the proportion of Spanish American Indians and labor force participation rate among population between the ages 35 and 44 in the United States with a correlation coefficient (R) of -0.022 and weighted average of 82.5%, a difference of 1.8%.
In Labor Force | Age 35-44 Correlation Summary
| Measurement | Welsh | Spanish American Indian |
| Minimum | 53.9% | 66.7% |
| Maximum | 100.0% | 100.0% |
| Range | 46.1% | 33.3% |
| Mean | 88.2% | 81.5% |
| Median | 85.5% | 81.8% |
| Interquartile 25% (IQ1) | 82.7% | 78.5% |
| Interquartile 75% (IQ3) | 100.0% | 84.3% |
| Interquartile Range (IQR) | 17.3% | 5.8% |
| Standard Deviation (Sample) | 9.7% | 6.4% |
| Standard Deviation (Population) | 9.6% | 6.3% |
Similar Demographics by In Labor Force | Age 35-44
Demographics Similar to Welsh by In Labor Force | Age 35-44
In terms of in labor force | age 35-44, the demographic groups most similar to Welsh are Panamanian (84.0%, a difference of 0.0%), British West Indian (84.0%, a difference of 0.0%), U.S. Virgin Islander (84.0%, a difference of 0.020%), Immigrants from Burma/Myanmar (84.0%, a difference of 0.020%), and Immigrants from Thailand (84.0%, a difference of 0.020%).
| Demographics | Rating | Rank | In Labor Force | Age 35-44 |
| Icelanders | 6.7 /100 | #221 | Tragic 84.0% |
| Assyrians/Chaldeans/Syriacs | 6.6 /100 | #222 | Tragic 84.0% |
| Immigrants | Panama | 6.4 /100 | #223 | Tragic 84.0% |
| U.S. Virgin Islanders | 6.1 /100 | #224 | Tragic 84.0% |
| Immigrants | Burma/Myanmar | 6.1 /100 | #225 | Tragic 84.0% |
| Panamanians | 5.4 /100 | #226 | Tragic 84.0% |
| British West Indians | 5.3 /100 | #227 | Tragic 84.0% |
| Welsh | 5.3 /100 | #228 | Tragic 84.0% |
| Immigrants | Thailand | 4.7 /100 | #229 | Tragic 84.0% |
| Immigrants | Iraq | 3.7 /100 | #230 | Tragic 83.9% |
| Scottish | 3.2 /100 | #231 | Tragic 83.9% |
| Native Hawaiians | 3.0 /100 | #232 | Tragic 83.9% |
| Immigrants | Germany | 2.8 /100 | #233 | Tragic 83.9% |
| Immigrants | Oceania | 2.6 /100 | #234 | Tragic 83.9% |
| Immigrants | Syria | 2.5 /100 | #235 | Tragic 83.9% |
Demographics Similar to Spanish American Indians by In Labor Force | Age 35-44
In terms of in labor force | age 35-44, the demographic groups most similar to Spanish American Indians are Central American Indian (82.5%, a difference of 0.020%), American (82.4%, a difference of 0.080%), Nepalese (82.4%, a difference of 0.080%), Marshallese (82.4%, a difference of 0.080%), and Tlingit-Haida (82.5%, a difference of 0.090%).
| Demographics | Rating | Rank | In Labor Force | Age 35-44 |
| Potawatomi | 0.0 /100 | #294 | Tragic 82.7% |
| Immigrants | Lebanon | 0.0 /100 | #295 | Tragic 82.7% |
| Mexican American Indians | 0.0 /100 | #296 | Tragic 82.6% |
| Hmong | 0.0 /100 | #297 | Tragic 82.6% |
| Ottawa | 0.0 /100 | #298 | Tragic 82.6% |
| Tlingit-Haida | 0.0 /100 | #299 | Tragic 82.5% |
| Central American Indians | 0.0 /100 | #300 | Tragic 82.5% |
| Spanish American Indians | 0.0 /100 | #301 | Tragic 82.5% |
| Americans | 0.0 /100 | #302 | Tragic 82.4% |
| Nepalese | 0.0 /100 | #303 | Tragic 82.4% |
| Marshallese | 0.0 /100 | #304 | Tragic 82.4% |
| Shoshone | 0.0 /100 | #305 | Tragic 82.2% |
| Blacks/African Americans | 0.0 /100 | #306 | Tragic 82.2% |
| Hispanics or Latinos | 0.0 /100 | #307 | Tragic 82.1% |
| Immigrants | Central America | 0.0 /100 | #308 | Tragic 82.0% |