Welsh vs Immigrants from Zaire Family Poverty
COMPARE
Welsh
Immigrants from Zaire
Family Poverty
Family Poverty Comparison
Welsh
Immigrants from Zaire
8.1%
FAMILY POVERTY
95.8/ 100
METRIC RATING
99th/ 347
METRIC RANK
10.7%
FAMILY POVERTY
0.3/ 100
METRIC RATING
252nd/ 347
METRIC RANK
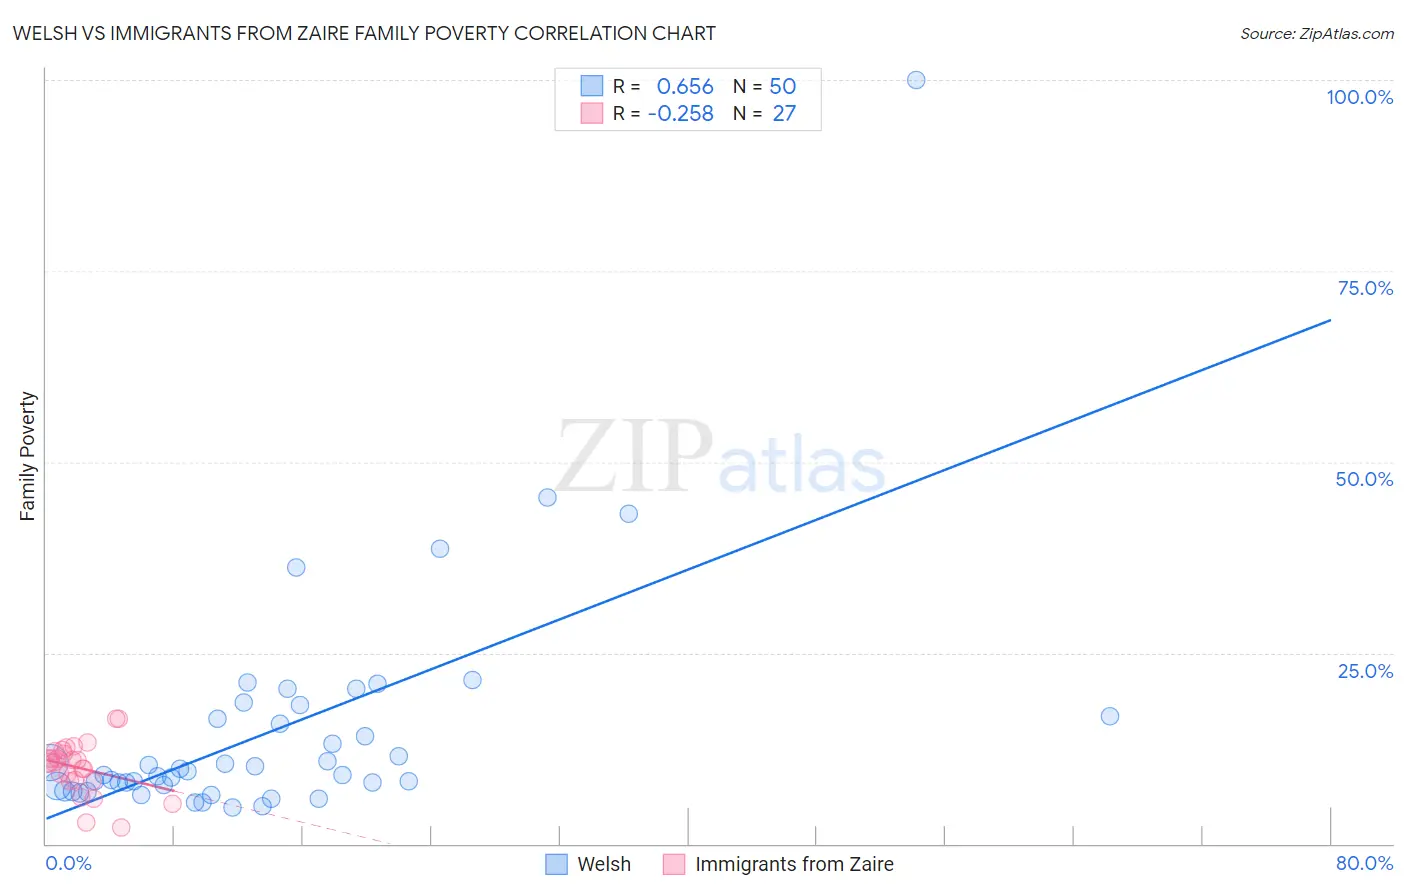
Welsh vs Immigrants from Zaire Family Poverty Correlation Chart
The statistical analysis conducted on geographies consisting of 525,428,616 people shows a significant positive correlation between the proportion of Welsh and poverty level among families in the United States with a correlation coefficient (R) of 0.656 and weighted average of 8.1%. Similarly, the statistical analysis conducted on geographies consisting of 107,226,893 people shows a weak negative correlation between the proportion of Immigrants from Zaire and poverty level among families in the United States with a correlation coefficient (R) of -0.258 and weighted average of 10.7%, a difference of 32.8%.
Family Poverty Correlation Summary
| Measurement | Welsh | Immigrants from Zaire |
| Minimum | 4.7% | 2.1% |
| Maximum | 100.0% | 16.4% |
| Range | 95.3% | 14.3% |
| Mean | 14.9% | 9.9% |
| Median | 9.2% | 10.6% |
| Interquartile 25% (IQ1) | 7.5% | 8.2% |
| Interquartile 75% (IQ3) | 16.7% | 12.1% |
| Interquartile Range (IQR) | 9.1% | 3.9% |
| Standard Deviation (Sample) | 15.6% | 3.4% |
| Standard Deviation (Population) | 15.4% | 3.4% |
Similar Demographics by Family Poverty
Demographics Similar to Welsh by Family Poverty
In terms of family poverty, the demographic groups most similar to Welsh are Immigrants from South Africa (8.1%, a difference of 0.070%), New Zealander (8.1%, a difference of 0.070%), Immigrants from Norway (8.1%, a difference of 0.10%), Immigrants from Indonesia (8.1%, a difference of 0.11%), and Immigrants from Eastern Europe (8.1%, a difference of 0.20%).
| Demographics | Rating | Rank | Family Poverty |
| Czechoslovakians | 96.8 /100 | #92 | Exceptional 8.0% |
| Tlingit-Haida | 96.7 /100 | #93 | Exceptional 8.0% |
| Immigrants | Pakistan | 96.6 /100 | #94 | Exceptional 8.0% |
| Immigrants | Philippines | 96.5 /100 | #95 | Exceptional 8.0% |
| Immigrants | Turkey | 96.5 /100 | #96 | Exceptional 8.0% |
| Immigrants | Switzerland | 96.1 /100 | #97 | Exceptional 8.1% |
| Immigrants | South Africa | 95.9 /100 | #98 | Exceptional 8.1% |
| Welsh | 95.8 /100 | #99 | Exceptional 8.1% |
| New Zealanders | 95.8 /100 | #100 | Exceptional 8.1% |
| Immigrants | Norway | 95.7 /100 | #101 | Exceptional 8.1% |
| Immigrants | Indonesia | 95.7 /100 | #102 | Exceptional 8.1% |
| Immigrants | Eastern Europe | 95.6 /100 | #103 | Exceptional 8.1% |
| Slavs | 95.6 /100 | #104 | Exceptional 8.1% |
| Laotians | 95.6 /100 | #105 | Exceptional 8.1% |
| Egyptians | 95.1 /100 | #106 | Exceptional 8.1% |
Demographics Similar to Immigrants from Zaire by Family Poverty
In terms of family poverty, the demographic groups most similar to Immigrants from Zaire are Immigrants from Western Africa (10.7%, a difference of 0.11%), Iroquois (10.7%, a difference of 0.12%), Salvadoran (10.7%, a difference of 0.40%), Ecuadorian (10.8%, a difference of 0.41%), and Immigrants from Liberia (10.8%, a difference of 0.78%).
| Demographics | Rating | Rank | Family Poverty |
| Immigrants | Burma/Myanmar | 0.6 /100 | #245 | Tragic 10.5% |
| Cherokee | 0.5 /100 | #246 | Tragic 10.6% |
| Liberians | 0.4 /100 | #247 | Tragic 10.6% |
| Nicaraguans | 0.4 /100 | #248 | Tragic 10.6% |
| Cubans | 0.4 /100 | #249 | Tragic 10.6% |
| Salvadorans | 0.3 /100 | #250 | Tragic 10.7% |
| Iroquois | 0.3 /100 | #251 | Tragic 10.7% |
| Immigrants | Zaire | 0.3 /100 | #252 | Tragic 10.7% |
| Immigrants | Western Africa | 0.3 /100 | #253 | Tragic 10.7% |
| Ecuadorians | 0.2 /100 | #254 | Tragic 10.8% |
| Immigrants | Liberia | 0.2 /100 | #255 | Tragic 10.8% |
| Chickasaw | 0.2 /100 | #256 | Tragic 10.8% |
| Immigrants | Ghana | 0.2 /100 | #257 | Tragic 10.8% |
| Sub-Saharan Africans | 0.2 /100 | #258 | Tragic 10.9% |
| Mexican American Indians | 0.2 /100 | #259 | Tragic 10.9% |