Houma vs Immigrants from Zaire Family Poverty
COMPARE
Houma
Immigrants from Zaire
Family Poverty
Family Poverty Comparison
Houma
Immigrants from Zaire
14.6%
FAMILY POVERTY
0.0/ 100
METRIC RATING
334th/ 347
METRIC RANK
10.7%
FAMILY POVERTY
0.3/ 100
METRIC RATING
252nd/ 347
METRIC RANK
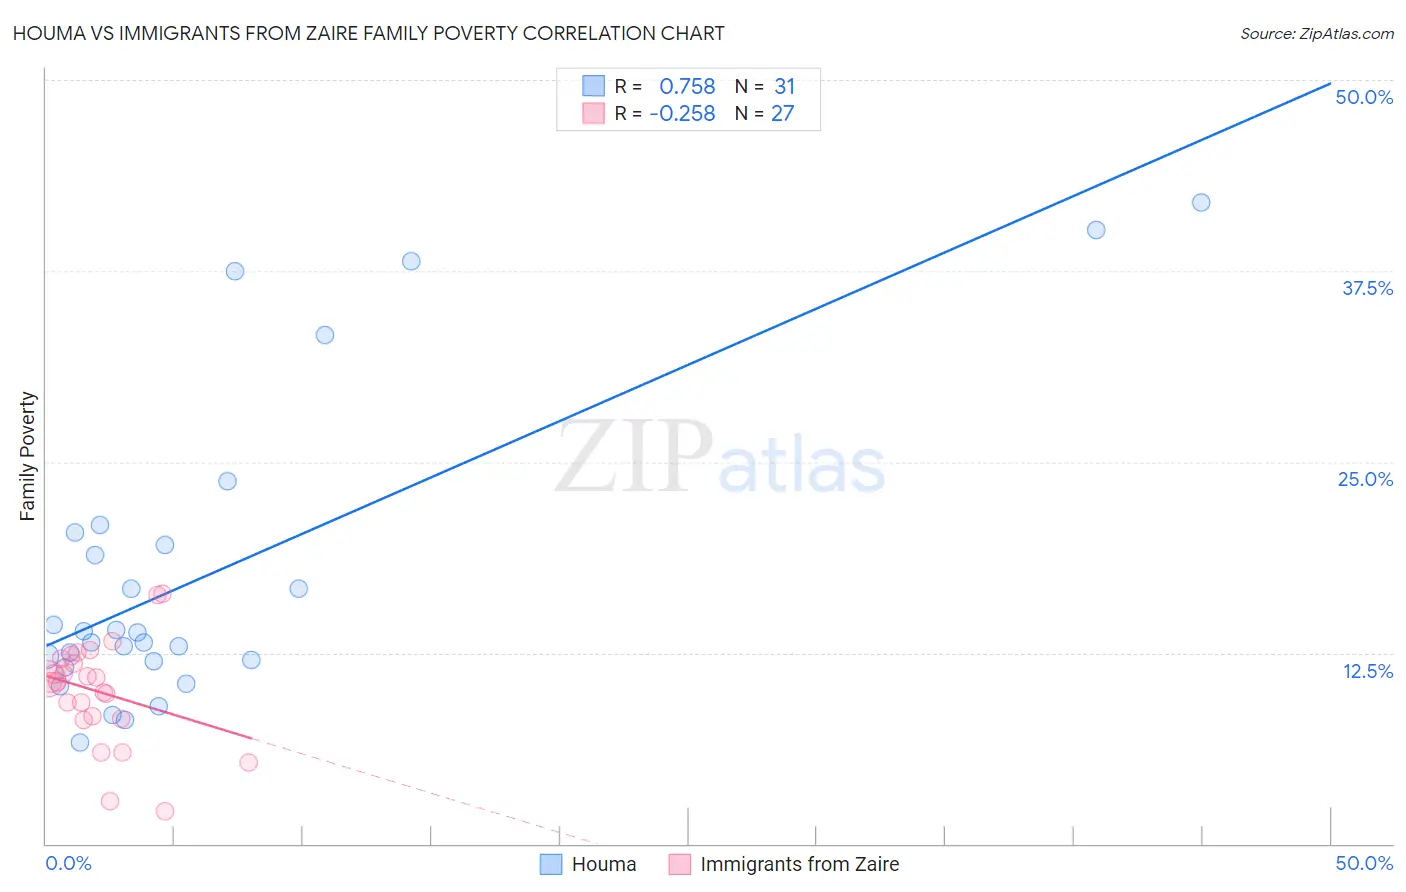
Houma vs Immigrants from Zaire Family Poverty Correlation Chart
The statistical analysis conducted on geographies consisting of 36,784,035 people shows a strong positive correlation between the proportion of Houma and poverty level among families in the United States with a correlation coefficient (R) of 0.758 and weighted average of 14.6%. Similarly, the statistical analysis conducted on geographies consisting of 107,226,893 people shows a weak negative correlation between the proportion of Immigrants from Zaire and poverty level among families in the United States with a correlation coefficient (R) of -0.258 and weighted average of 10.7%, a difference of 36.2%.
Family Poverty Correlation Summary
| Measurement | Houma | Immigrants from Zaire |
| Minimum | 6.6% | 2.1% |
| Maximum | 42.0% | 16.4% |
| Range | 35.4% | 14.3% |
| Mean | 17.7% | 9.9% |
| Median | 13.8% | 10.6% |
| Interquartile 25% (IQ1) | 12.0% | 8.2% |
| Interquartile 75% (IQ3) | 20.4% | 12.1% |
| Interquartile Range (IQR) | 8.4% | 3.9% |
| Standard Deviation (Sample) | 10.0% | 3.4% |
| Standard Deviation (Population) | 9.8% | 3.4% |
Similar Demographics by Family Poverty
Demographics Similar to Houma by Family Poverty
In terms of family poverty, the demographic groups most similar to Houma are Apache (14.7%, a difference of 0.85%), Immigrants from Dominican Republic (14.4%, a difference of 1.3%), Dominican (14.3%, a difference of 1.9%), Cheyenne (14.3%, a difference of 2.4%), and Native/Alaskan (14.3%, a difference of 2.5%).
| Demographics | Rating | Rank | Family Poverty |
| Yakama | 0.0 /100 | #327 | Tragic 13.1% |
| Central American Indians | 0.0 /100 | #328 | Tragic 13.3% |
| Blacks/African Americans | 0.0 /100 | #329 | Tragic 13.3% |
| Natives/Alaskans | 0.0 /100 | #330 | Tragic 14.3% |
| Cheyenne | 0.0 /100 | #331 | Tragic 14.3% |
| Dominicans | 0.0 /100 | #332 | Tragic 14.3% |
| Immigrants | Dominican Republic | 0.0 /100 | #333 | Tragic 14.4% |
| Houma | 0.0 /100 | #334 | Tragic 14.6% |
| Apache | 0.0 /100 | #335 | Tragic 14.7% |
| Sioux | 0.0 /100 | #336 | Tragic 15.9% |
| Hopi | 0.0 /100 | #337 | Tragic 15.9% |
| Crow | 0.0 /100 | #338 | Tragic 16.1% |
| Yuman | 0.0 /100 | #339 | Tragic 16.6% |
| Pueblo | 0.0 /100 | #340 | Tragic 17.0% |
| Lumbee | 0.0 /100 | #341 | Tragic 17.0% |
Demographics Similar to Immigrants from Zaire by Family Poverty
In terms of family poverty, the demographic groups most similar to Immigrants from Zaire are Immigrants from Western Africa (10.7%, a difference of 0.11%), Iroquois (10.7%, a difference of 0.12%), Salvadoran (10.7%, a difference of 0.40%), Ecuadorian (10.8%, a difference of 0.41%), and Immigrants from Liberia (10.8%, a difference of 0.78%).
| Demographics | Rating | Rank | Family Poverty |
| Immigrants | Burma/Myanmar | 0.6 /100 | #245 | Tragic 10.5% |
| Cherokee | 0.5 /100 | #246 | Tragic 10.6% |
| Liberians | 0.4 /100 | #247 | Tragic 10.6% |
| Nicaraguans | 0.4 /100 | #248 | Tragic 10.6% |
| Cubans | 0.4 /100 | #249 | Tragic 10.6% |
| Salvadorans | 0.3 /100 | #250 | Tragic 10.7% |
| Iroquois | 0.3 /100 | #251 | Tragic 10.7% |
| Immigrants | Zaire | 0.3 /100 | #252 | Tragic 10.7% |
| Immigrants | Western Africa | 0.3 /100 | #253 | Tragic 10.7% |
| Ecuadorians | 0.2 /100 | #254 | Tragic 10.8% |
| Immigrants | Liberia | 0.2 /100 | #255 | Tragic 10.8% |
| Chickasaw | 0.2 /100 | #256 | Tragic 10.8% |
| Immigrants | Ghana | 0.2 /100 | #257 | Tragic 10.8% |
| Sub-Saharan Africans | 0.2 /100 | #258 | Tragic 10.9% |
| Mexican American Indians | 0.2 /100 | #259 | Tragic 10.9% |