Welsh vs Immigrants from Zaire Bachelor's Degree
COMPARE
Welsh
Immigrants from Zaire
Bachelor's Degree
Bachelor's Degree Comparison
Welsh
Immigrants from Zaire
37.0%
BACHELOR'S DEGREE
29.1/ 100
METRIC RATING
198th/ 347
METRIC RANK
36.8%
BACHELOR'S DEGREE
25.3/ 100
METRIC RATING
202nd/ 347
METRIC RANK
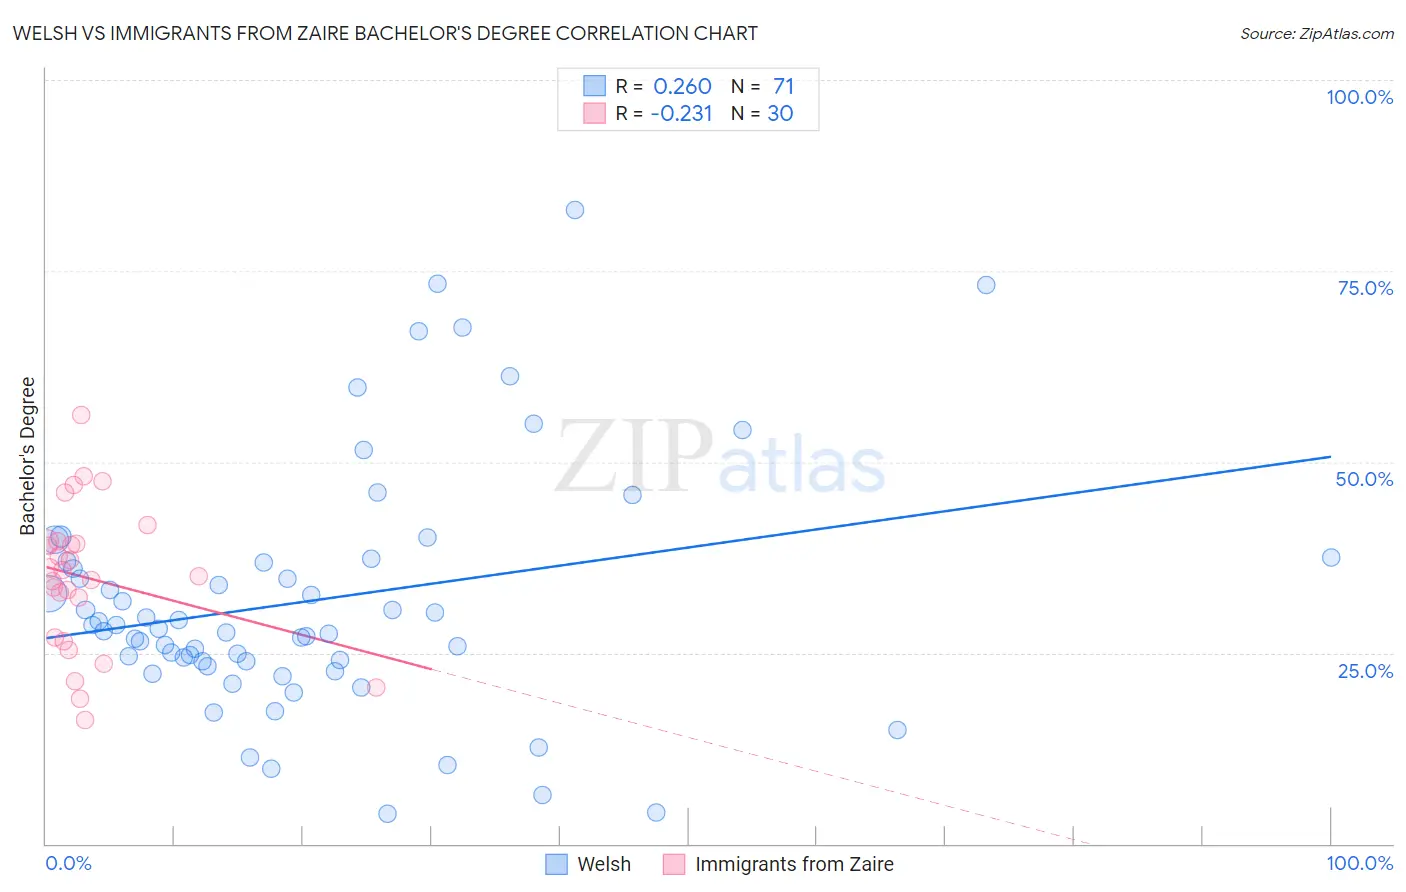
Welsh vs Immigrants from Zaire Bachelor's Degree Correlation Chart
The statistical analysis conducted on geographies consisting of 528,521,285 people shows a weak positive correlation between the proportion of Welsh and percentage of population with at least bachelor's degree education in the United States with a correlation coefficient (R) of 0.260 and weighted average of 37.0%. Similarly, the statistical analysis conducted on geographies consisting of 107,252,315 people shows a weak negative correlation between the proportion of Immigrants from Zaire and percentage of population with at least bachelor's degree education in the United States with a correlation coefficient (R) of -0.231 and weighted average of 36.8%, a difference of 0.49%.
Bachelor's Degree Correlation Summary
| Measurement | Welsh | Immigrants from Zaire |
| Minimum | 3.9% | 16.2% |
| Maximum | 83.0% | 56.2% |
| Range | 79.1% | 40.0% |
| Mean | 31.9% | 34.8% |
| Median | 28.2% | 35.4% |
| Interquartile 25% (IQ1) | 23.9% | 27.1% |
| Interquartile 75% (IQ3) | 36.9% | 39.5% |
| Interquartile Range (IQR) | 13.0% | 12.4% |
| Standard Deviation (Sample) | 16.3% | 9.4% |
| Standard Deviation (Population) | 16.2% | 9.3% |
Demographics Similar to Welsh and Immigrants from Zaire by Bachelor's Degree
In terms of bachelor's degree, the demographic groups most similar to Welsh are Czechoslovakian (37.0%, a difference of 0.010%), Celtic (37.0%, a difference of 0.050%), Korean (37.0%, a difference of 0.080%), Belgian (37.0%, a difference of 0.10%), and Immigrants from Costa Rica (36.9%, a difference of 0.21%). Similarly, the demographic groups most similar to Immigrants from Zaire are Immigrants from South Eastern Asia (36.8%, a difference of 0.010%), Immigrants from Ghana (36.9%, a difference of 0.27%), Immigrants from Costa Rica (36.9%, a difference of 0.28%), Immigrants from Nigeria (36.7%, a difference of 0.29%), and Immigrants (36.7%, a difference of 0.33%).
| Demographics | Rating | Rank | Bachelor's Degree |
| Swiss | 34.1 /100 | #190 | Fair 37.2% |
| Nigerians | 33.9 /100 | #191 | Fair 37.2% |
| Immigrants | Vietnam | 32.1 /100 | #192 | Fair 37.1% |
| Yugoslavians | 31.5 /100 | #193 | Fair 37.1% |
| Belgians | 29.9 /100 | #194 | Fair 37.0% |
| Koreans | 29.8 /100 | #195 | Fair 37.0% |
| Celtics | 29.5 /100 | #196 | Fair 37.0% |
| Czechoslovakians | 29.2 /100 | #197 | Fair 37.0% |
| Welsh | 29.1 /100 | #198 | Fair 37.0% |
| Immigrants | Costa Rica | 27.4 /100 | #199 | Fair 36.9% |
| Immigrants | Ghana | 27.4 /100 | #200 | Fair 36.9% |
| Immigrants | South Eastern Asia | 25.4 /100 | #201 | Fair 36.8% |
| Immigrants | Zaire | 25.3 /100 | #202 | Fair 36.8% |
| Immigrants | Nigeria | 23.1 /100 | #203 | Fair 36.7% |
| Immigrants | Immigrants | 22.8 /100 | #204 | Fair 36.7% |
| Finns | 22.2 /100 | #205 | Fair 36.7% |
| Spaniards | 21.2 /100 | #206 | Fair 36.6% |
| Immigrants | Middle Africa | 20.6 /100 | #207 | Fair 36.6% |
| Immigrants | Thailand | 19.4 /100 | #208 | Poor 36.5% |
| Panamanians | 18.8 /100 | #209 | Poor 36.5% |
| French | 18.6 /100 | #210 | Poor 36.5% |