Welsh vs Immigrants from Europe Family Poverty
COMPARE
Welsh
Immigrants from Europe
Family Poverty
Family Poverty Comparison
Welsh
Immigrants from Europe
8.1%
FAMILY POVERTY
95.8/ 100
METRIC RATING
99th/ 347
METRIC RANK
7.9%
FAMILY POVERTY
97.8/ 100
METRIC RATING
79th/ 347
METRIC RANK
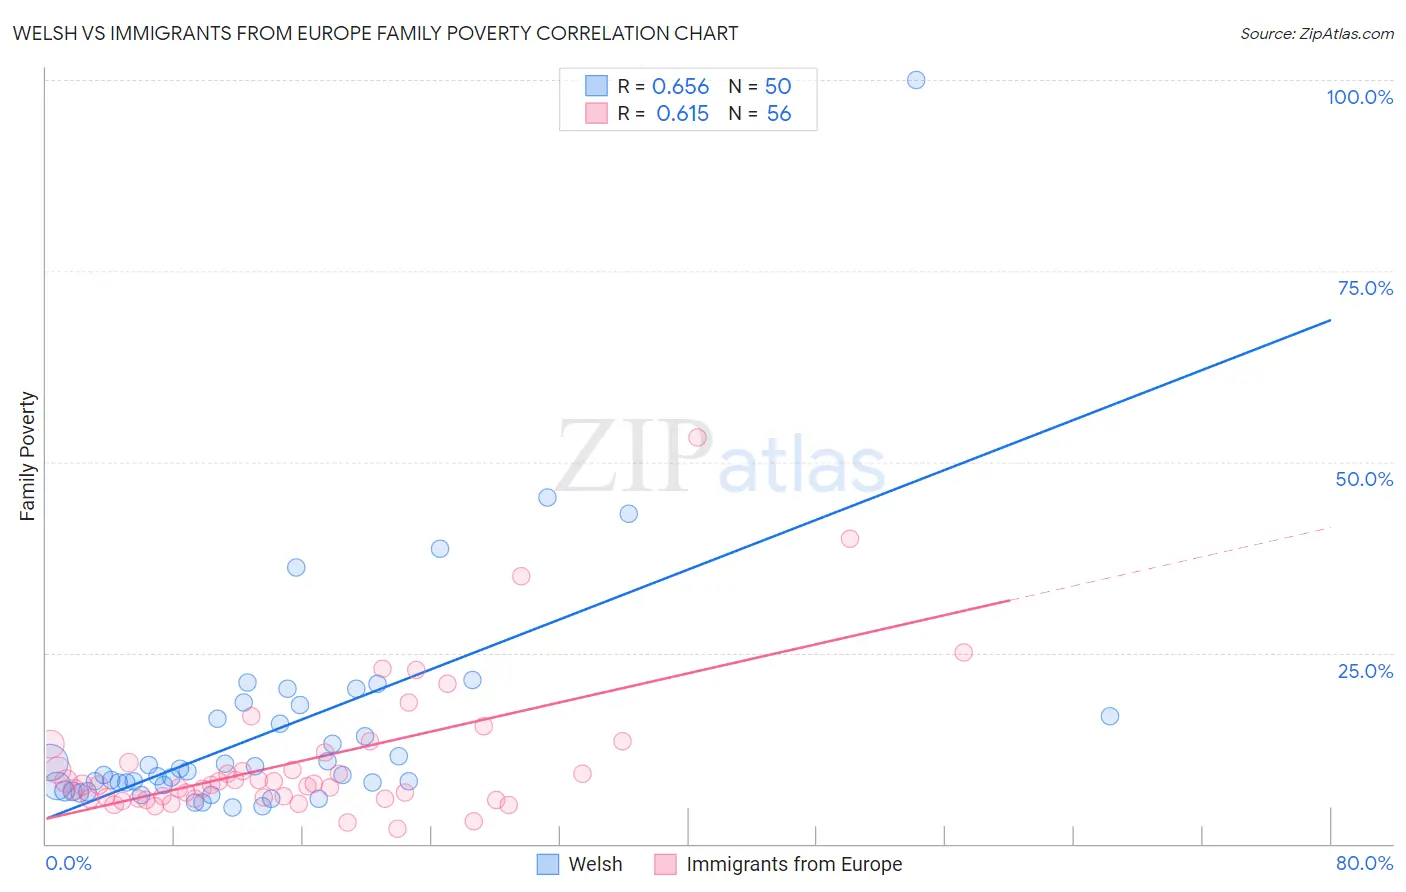
Welsh vs Immigrants from Europe Family Poverty Correlation Chart
The statistical analysis conducted on geographies consisting of 525,428,616 people shows a significant positive correlation between the proportion of Welsh and poverty level among families in the United States with a correlation coefficient (R) of 0.656 and weighted average of 8.1%. Similarly, the statistical analysis conducted on geographies consisting of 543,618,397 people shows a significant positive correlation between the proportion of Immigrants from Europe and poverty level among families in the United States with a correlation coefficient (R) of 0.615 and weighted average of 7.9%, a difference of 2.5%.
Family Poverty Correlation Summary
| Measurement | Welsh | Immigrants from Europe |
| Minimum | 4.7% | 1.9% |
| Maximum | 100.0% | 53.2% |
| Range | 95.3% | 51.3% |
| Mean | 14.9% | 10.9% |
| Median | 9.2% | 7.7% |
| Interquartile 25% (IQ1) | 7.5% | 5.9% |
| Interquartile 75% (IQ3) | 16.7% | 11.3% |
| Interquartile Range (IQR) | 9.1% | 5.4% |
| Standard Deviation (Sample) | 15.6% | 9.3% |
| Standard Deviation (Population) | 15.4% | 9.2% |
Demographics Similar to Welsh and Immigrants from Europe by Family Poverty
In terms of family poverty, the demographic groups most similar to Welsh are Immigrants from South Africa (8.1%, a difference of 0.070%), Immigrants from Switzerland (8.1%, a difference of 0.28%), Immigrants from Turkey (8.0%, a difference of 0.69%), Immigrants from Philippines (8.0%, a difference of 0.71%), and Immigrants from Pakistan (8.0%, a difference of 0.72%). Similarly, the demographic groups most similar to Immigrants from Europe are English (7.9%, a difference of 0.060%), Irish (7.9%, a difference of 0.070%), Immigrants from Poland (7.9%, a difference of 0.090%), Slovak (7.9%, a difference of 0.27%), and British (7.9%, a difference of 0.52%).
| Demographics | Rating | Rank | Family Poverty |
| Immigrants | Europe | 97.8 /100 | #79 | Exceptional 7.9% |
| English | 97.8 /100 | #80 | Exceptional 7.9% |
| Irish | 97.8 /100 | #81 | Exceptional 7.9% |
| Immigrants | Poland | 97.8 /100 | #82 | Exceptional 7.9% |
| Slovaks | 97.7 /100 | #83 | Exceptional 7.9% |
| British | 97.5 /100 | #84 | Exceptional 7.9% |
| Immigrants | Asia | 97.4 /100 | #85 | Exceptional 7.9% |
| Scottish | 97.3 /100 | #86 | Exceptional 7.9% |
| Belgians | 97.3 /100 | #87 | Exceptional 8.0% |
| Serbians | 97.2 /100 | #88 | Exceptional 8.0% |
| Immigrants | Denmark | 97.1 /100 | #89 | Exceptional 8.0% |
| Immigrants | England | 97.1 /100 | #90 | Exceptional 8.0% |
| Immigrants | Italy | 97.0 /100 | #91 | Exceptional 8.0% |
| Czechoslovakians | 96.8 /100 | #92 | Exceptional 8.0% |
| Tlingit-Haida | 96.7 /100 | #93 | Exceptional 8.0% |
| Immigrants | Pakistan | 96.6 /100 | #94 | Exceptional 8.0% |
| Immigrants | Philippines | 96.5 /100 | #95 | Exceptional 8.0% |
| Immigrants | Turkey | 96.5 /100 | #96 | Exceptional 8.0% |
| Immigrants | Switzerland | 96.1 /100 | #97 | Exceptional 8.1% |
| Immigrants | South Africa | 95.9 /100 | #98 | Exceptional 8.1% |
| Welsh | 95.8 /100 | #99 | Exceptional 8.1% |