Welsh vs Immigrants from Zaire Single Father Poverty
COMPARE
Welsh
Immigrants from Zaire
Single Father Poverty
Single Father Poverty Comparison
Welsh
Immigrants from Zaire
17.8%
SINGLE FATHER POVERTY
0.0/ 100
METRIC RATING
284th/ 347
METRIC RANK
17.3%
SINGLE FATHER POVERTY
0.4/ 100
METRIC RATING
262nd/ 347
METRIC RANK
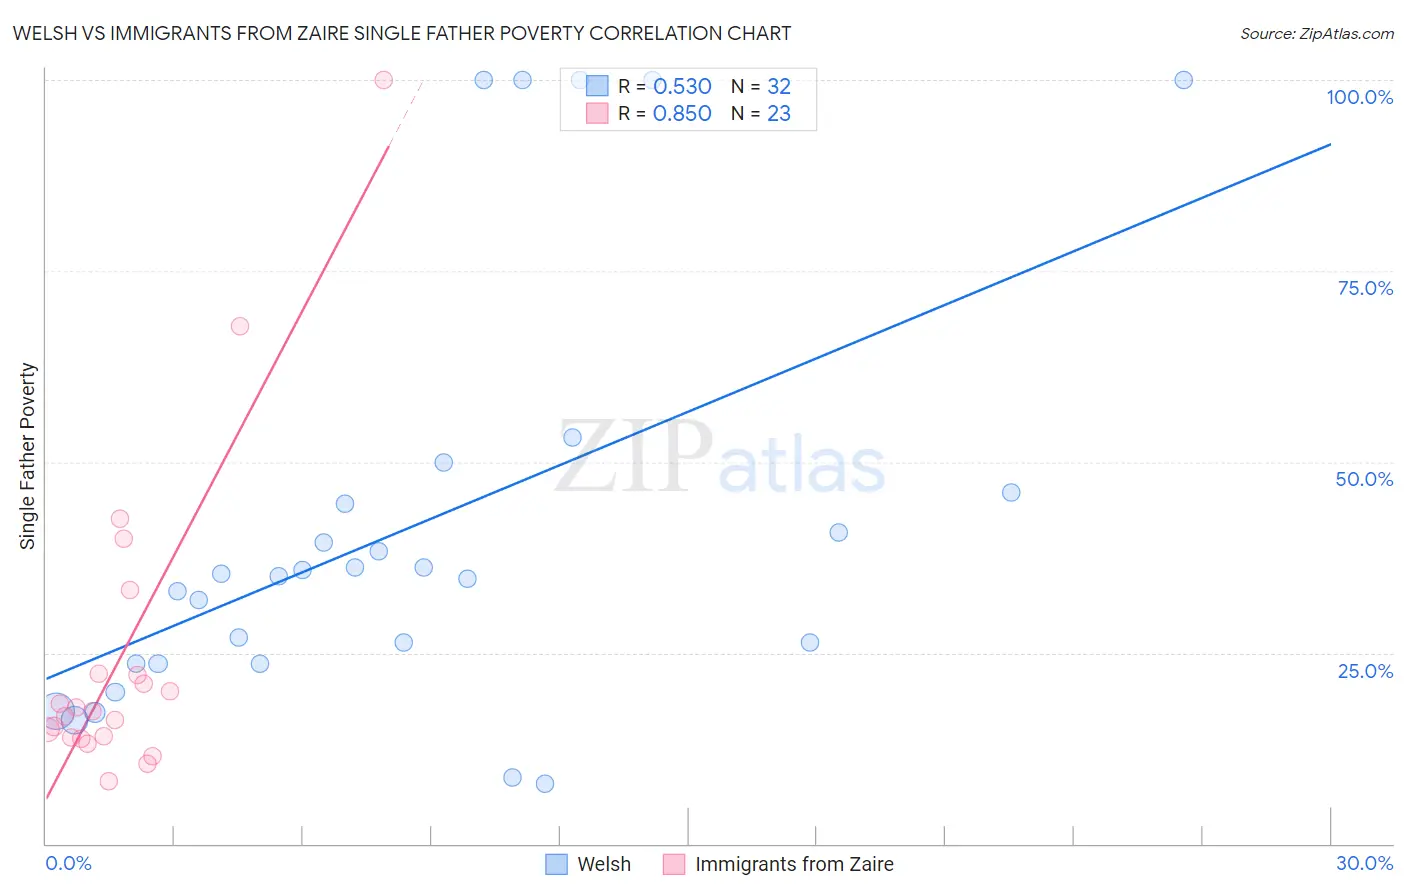
Welsh vs Immigrants from Zaire Single Father Poverty Correlation Chart
The statistical analysis conducted on geographies consisting of 385,351,851 people shows a substantial positive correlation between the proportion of Welsh and poverty level among single fathers in the United States with a correlation coefficient (R) of 0.530 and weighted average of 17.8%. Similarly, the statistical analysis conducted on geographies consisting of 97,955,340 people shows a very strong positive correlation between the proportion of Immigrants from Zaire and poverty level among single fathers in the United States with a correlation coefficient (R) of 0.850 and weighted average of 17.3%, a difference of 3.1%.
Single Father Poverty Correlation Summary
| Measurement | Welsh | Immigrants from Zaire |
| Minimum | 7.8% | 8.2% |
| Maximum | 100.0% | 100.0% |
| Range | 92.2% | 91.8% |
| Mean | 41.5% | 24.8% |
| Median | 35.2% | 17.3% |
| Interquartile 25% (IQ1) | 23.6% | 14.0% |
| Interquartile 75% (IQ3) | 45.3% | 22.3% |
| Interquartile Range (IQR) | 21.7% | 8.3% |
| Standard Deviation (Sample) | 27.8% | 21.1% |
| Standard Deviation (Population) | 27.3% | 20.6% |
Similar Demographics by Single Father Poverty
Demographics Similar to Welsh by Single Father Poverty
In terms of single father poverty, the demographic groups most similar to Welsh are Alsatian (17.8%, a difference of 0.020%), Dutch (17.8%, a difference of 0.11%), English (17.8%, a difference of 0.12%), Immigrants from Lebanon (17.9%, a difference of 0.37%), and Scottish (17.7%, a difference of 0.43%).
| Demographics | Rating | Rank | Single Father Poverty |
| Lebanese | 0.0 /100 | #277 | Tragic 17.7% |
| Germans | 0.0 /100 | #278 | Tragic 17.7% |
| Iroquois | 0.0 /100 | #279 | Tragic 17.7% |
| Scottish | 0.0 /100 | #280 | Tragic 17.7% |
| English | 0.0 /100 | #281 | Tragic 17.8% |
| Dutch | 0.0 /100 | #282 | Tragic 17.8% |
| Alsatians | 0.0 /100 | #283 | Tragic 17.8% |
| Welsh | 0.0 /100 | #284 | Tragic 17.8% |
| Immigrants | Lebanon | 0.0 /100 | #285 | Tragic 17.9% |
| Immigrants | North Macedonia | 0.0 /100 | #286 | Tragic 17.9% |
| Carpatho Rusyns | 0.0 /100 | #287 | Tragic 18.0% |
| Bahamians | 0.0 /100 | #288 | Tragic 18.0% |
| Irish | 0.0 /100 | #289 | Tragic 18.0% |
| West Indians | 0.0 /100 | #290 | Tragic 18.0% |
| Alaskan Athabascans | 0.0 /100 | #291 | Tragic 18.1% |
Demographics Similar to Immigrants from Zaire by Single Father Poverty
In terms of single father poverty, the demographic groups most similar to Immigrants from Zaire are Lithuanian (17.3%, a difference of 0.010%), Swiss (17.3%, a difference of 0.13%), Slovene (17.3%, a difference of 0.22%), Polish (17.3%, a difference of 0.22%), and Jamaican (17.3%, a difference of 0.27%).
| Demographics | Rating | Rank | Single Father Poverty |
| Sierra Leoneans | 0.8 /100 | #255 | Tragic 17.2% |
| Immigrants | Haiti | 0.8 /100 | #256 | Tragic 17.2% |
| Immigrants | Albania | 0.7 /100 | #257 | Tragic 17.2% |
| Albanians | 0.7 /100 | #258 | Tragic 17.2% |
| Immigrants | Jamaica | 0.7 /100 | #259 | Tragic 17.2% |
| Spaniards | 0.6 /100 | #260 | Tragic 17.2% |
| Swiss | 0.5 /100 | #261 | Tragic 17.3% |
| Immigrants | Zaire | 0.4 /100 | #262 | Tragic 17.3% |
| Lithuanians | 0.4 /100 | #263 | Tragic 17.3% |
| Slovenes | 0.3 /100 | #264 | Tragic 17.3% |
| Poles | 0.3 /100 | #265 | Tragic 17.3% |
| Jamaicans | 0.3 /100 | #266 | Tragic 17.3% |
| Haitians | 0.3 /100 | #267 | Tragic 17.3% |
| Immigrants | Caribbean | 0.3 /100 | #268 | Tragic 17.4% |
| Slavs | 0.3 /100 | #269 | Tragic 17.4% |