Australian vs Immigrants from Zaire Family Poverty

COMPARE

Australian
Race
Ancestry
AfghanAfricanAlaska NativeAlaskan AthabascanAlbanianAleutAlsatianAmericanApacheArabArapahoArgentineanArmenianAssyrian/Chaldean/SyriacAustralianAustrianBahamianBangladeshiBarbadianBasqueBelgianBelizeanBermudanBhutaneseBlackfeetBolivianBrazilianBritishBritish West IndianBulgarianBurmeseCajunCambodianCanadianCape VerdeanCarpatho RusynCelticCentral AmericanCentral American IndianCherokeeCheyenneChickasawChileanChineseChippewaChoctawColombianColvilleComancheCosta RicanCreeCreekCroatianCrowCubanCypriotCzechCzechoslovakianDanishDelawareDominicanDutchDutch West IndianEastern EuropeanEcuadorianEgyptianEnglishEstonianEthiopianEuropeanFijianFilipinoFinnishFrenchFrench American IndianFrench CanadianGermanGerman RussianGhanaianGreekGuamanian/ChamorroGuatemalanGuyaneseHaitianHmongHonduranHopiHoumaHungarianIcelanderIndian (Asian)IndonesianInupiatIranianIraqiIrishIroquoisIsraeliItalianJamaicanJapaneseJordanianKenyanKiowaKoreanLaotianLatvianLebaneseLiberianLithuanianLumbeeLuxembourgerMacedonianMalaysianMalteseMarshalleseMenomineeMexicanMexican American IndianMongolianMoroccanNative HawaiianNavajoNepaleseNew ZealanderNicaraguanNigerianNorthern EuropeanNorwegianOkinawanOsageOttawaPaiutePakistaniPalestinianPanamanianParaguayanPennsylvania GermanPeruvianPimaPolishPortuguesePotawatomiPuebloPuerto RicanPuget Sound SalishRomanianRussianSalvadoranSamoanScandinavianScotch-IrishScottishSeminoleSenegaleseSerbianShoshoneSierra LeoneanSiouxSlavicSlovakSloveneSomaliSouth AfricanSouth AmericanSouth American IndianSoviet UnionSpaniardSpanishSpanish AmericanSpanish American IndianSri LankanSubsaharan AfricanSudaneseSwedishSwissSyrianTaiwaneseThaiTlingit-HaidaTohono O'OdhamTonganTrinidadian and TobagonianTsimshianTurkishU.S. Virgin IslanderUgandanUkrainianUruguayanUteVenezuelanVietnameseWelshWest IndianYakamaYaquiYugoslavianYumanYup'ikZimbabwean
Immigration
NonimmigrantsImmigrantsAfghanistanAfricaAlbaniaArgentinaArmeniaAsiaAustraliaAustriaBahamasBangladeshBarbadosBelarusBelgiumBelizeBoliviaBosnia and HerzegovinaBrazilBulgariaBurma/MyanmarCabo VerdeCambodiaCameroonCanadaCaribbeanCentral AmericaChileChinaColombiaCongoCosta RicaCroatiaCubaCzechoslovakiaDenmarkDominicaDominican RepublicEastern AfricaEastern AsiaEastern EuropeEcuadorEgyptEl SalvadorEnglandEritreaEthiopiaEuropeFijiFranceGermanyGhanaGreeceGrenadaGuatemalaGuyanaHaitiHondurasHong KongHungaryIndiaIndonesiaIranIraqIrelandIsraelItalyJamaicaJapanJordanKazakhstanKenyaKoreaKuwaitLaosLatin AmericaLatviaLebanonLiberiaLithuaniaMalaysiaMexicoMicronesiaMiddle AfricaMoldovaMoroccoNepalNetherlandsNicaraguaNigeriaNorth AmericaNorth MacedoniaNorthern AfricaNorthern EuropeNorwayOceaniaPakistanPanamaPeruPhilippinesPolandPortugalRomaniaRussiaSaudi ArabiaScotlandSenegalSerbiaSierra LeoneSingaporeSomaliaSouth AfricaSouth AmericaSouth Central AsiaSouth Eastern AsiaSouthern EuropeSpainSri LankaSt. Vincent and the GrenadinesSudanSwedenSwitzerlandSyriaTaiwanThailandTrinidad and TobagoTurkeyUgandaUkraineUruguayUzbekistanVenezuelaVietnamWest IndiesWestern AfricaWestern AsiaWestern EuropeYemenZimbabweAzores
Immigrants from Zaire
Race
Ancestry
AfghanAfricanAlaska NativeAlaskan AthabascanAlbanianAleutAlsatianAmericanApacheArabArapahoArgentineanArmenianAssyrian/Chaldean/SyriacAustrianBahamianBangladeshiBarbadianBasqueBelgianBelizeanBermudanBhutaneseBlackfeetBolivianBrazilianBritishBritish West IndianBulgarianBurmeseCajunCambodianCanadianCape VerdeanCarpatho RusynCelticCentral AmericanCentral American IndianCherokeeCheyenneChickasawChileanChineseChippewaChoctawColombianColvilleComancheCosta RicanCreeCreekCroatianCrowCubanCypriotCzechCzechoslovakianDanishDelawareDominicanDutchDutch West IndianEastern EuropeanEcuadorianEgyptianEnglishEstonianEthiopianEuropeanFijianFilipinoFinnishFrenchFrench American IndianFrench CanadianGermanGerman RussianGhanaianGreekGuamanian/ChamorroGuatemalanGuyaneseHaitianHmongHonduranHopiHoumaHungarianIcelanderIndian (Asian)IndonesianInupiatIranianIraqiIrishIroquoisIsraeliItalianJamaicanJapaneseJordanianKenyanKiowaKoreanLaotianLatvianLebaneseLiberianLithuanianLumbeeLuxembourgerMacedonianMalaysianMalteseMarshalleseMenomineeMexicanMexican American IndianMongolianMoroccanNative HawaiianNavajoNepaleseNew ZealanderNicaraguanNigerianNorthern EuropeanNorwegianOkinawanOsageOttawaPaiutePakistaniPalestinianPanamanianParaguayanPennsylvania GermanPeruvianPimaPolishPortuguesePotawatomiPuebloPuerto RicanPuget Sound SalishRomanianRussianSalvadoranSamoanScandinavianScotch-IrishScottishSeminoleSenegaleseSerbianShoshoneSierra LeoneanSiouxSlavicSlovakSloveneSomaliSouth AfricanSouth AmericanSouth American IndianSoviet UnionSpaniardSpanishSpanish AmericanSpanish American IndianSri LankanSubsaharan AfricanSudaneseSwedishSwissSyrianTaiwaneseThaiTlingit-HaidaTohono O'OdhamTonganTrinidadian and TobagonianTsimshianTurkishU.S. Virgin IslanderUgandanUkrainianUruguayanUteVenezuelanVietnameseWelshWest IndianYakamaYaquiYugoslavianYumanYup'ikZimbabwean
Immigration
NonimmigrantsImmigrantsAfghanistanAfricaAlbaniaArgentinaArmeniaAsiaAustraliaAustriaBahamasBangladeshBarbadosBelarusBelgiumBelizeBoliviaBosnia and HerzegovinaBrazilBulgariaBurma/MyanmarCabo VerdeCambodiaCameroonCanadaCaribbeanCentral AmericaChileChinaColombiaCongoCosta RicaCroatiaCubaCzechoslovakiaDenmarkDominicaDominican RepublicEastern AfricaEastern AsiaEastern EuropeEcuadorEgyptEl SalvadorEnglandEritreaEthiopiaEuropeFijiFranceGermanyGhanaGreeceGrenadaGuatemalaGuyanaHaitiHondurasHong KongHungaryIndiaIndonesiaIranIraqIrelandIsraelItalyJamaicaJapanJordanKazakhstanKenyaKoreaKuwaitLaosLatin AmericaLatviaLebanonLiberiaLithuaniaMalaysiaMexicoMicronesiaMiddle AfricaMoldovaMoroccoNepalNetherlandsNicaraguaNigeriaNorth AmericaNorth MacedoniaNorthern AfricaNorthern EuropeNorwayOceaniaPakistanPanamaPeruPhilippinesPolandPortugalRomaniaRussiaSaudi ArabiaScotlandSenegalSerbiaSierra LeoneSingaporeSomaliaSouth AfricaSouth AmericaSouth Central AsiaSouth Eastern AsiaSouthern EuropeSpainSri LankaSt. Vincent and the GrenadinesSudanSwedenSwitzerlandSyriaTaiwanThailandTrinidad and TobagoTurkeyUgandaUkraineUruguayUzbekistanVenezuelaVietnamWest IndiesWestern AfricaWestern AsiaWestern EuropeYemenZaireZimbabweAzores
Family Poverty
Income
Poverty
Unemployment
Labor Participation
Family Structure
Vehicle Availability
Education Level
Disability

Family Poverty Comparison

Australians

Immigrants from Zaire

Exceptional
Tragic
7.8%
FAMILY POVERTY
98.2/ 100
METRIC RATING
68th/ 347
METRIC RANK
10.7%
FAMILY POVERTY
0.3/ 100
METRIC RATING
252nd/ 347
METRIC RANK

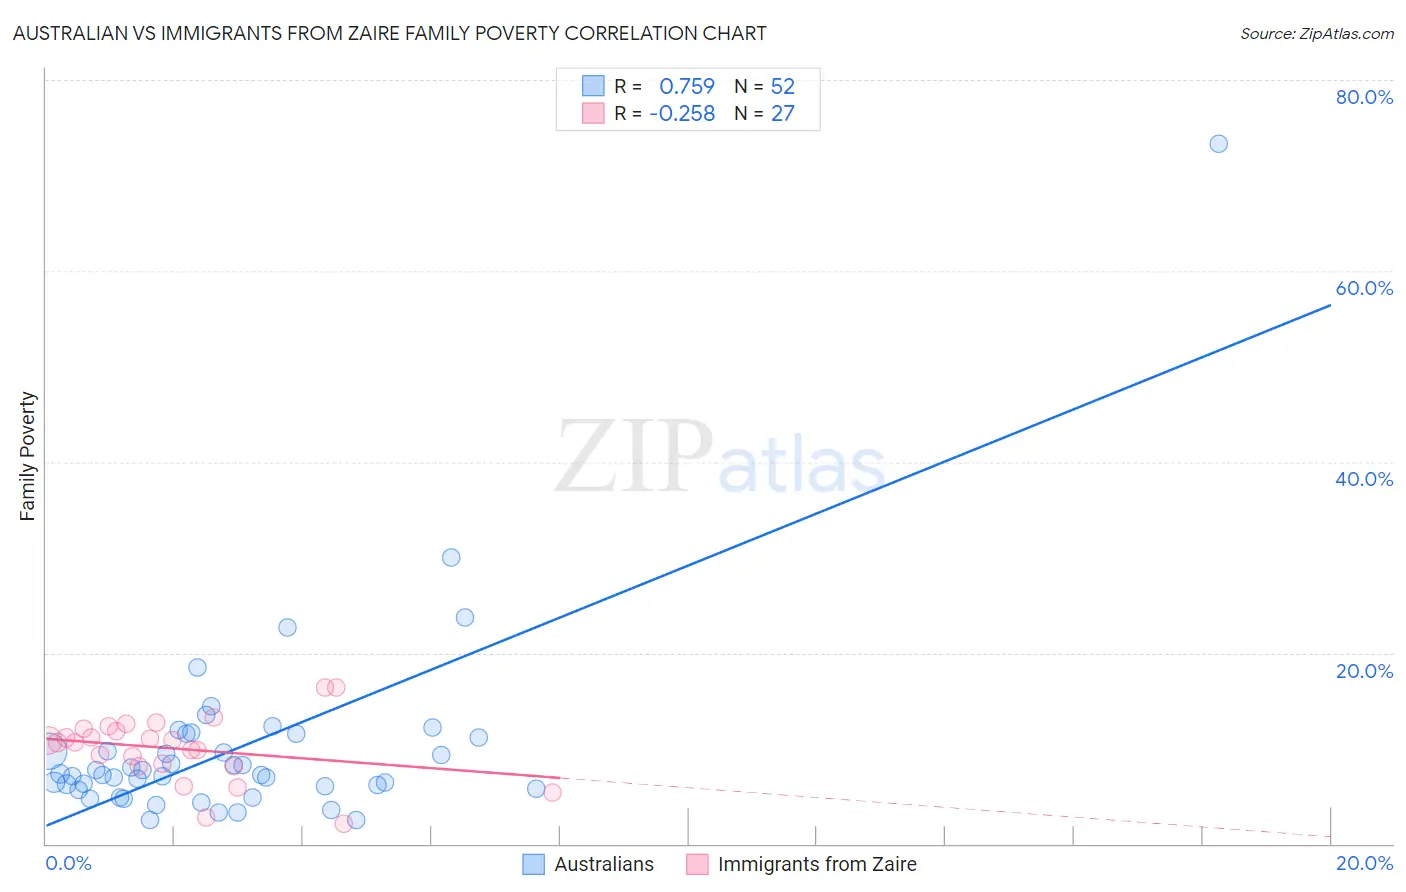
Australian vs Immigrants from Zaire Family Poverty Correlation Chart

The statistical analysis conducted on geographies consisting of 223,701,792 people shows a strong positive correlation between the proportion of Australians and poverty level among families in the United States with a correlation coefficient (R) of 0.759 and weighted average of 7.8%. Similarly, the statistical analysis conducted on geographies consisting of 107,226,893 people shows a weak negative correlation between the proportion of Immigrants from Zaire and poverty level among families in the United States with a correlation coefficient (R) of -0.258 and weighted average of 10.7%, a difference of 37.2%.
Australian vs Immigrants from Zaire Family Poverty

Family Poverty Correlation Summary

MeasurementAustralianImmigrants from Zaire
Minimum2.4%2.1%
Maximum73.3%16.4%
Range70.9%14.3%
Mean10.0%9.9%
Median7.3%10.6%
Interquartile 25% (IQ1)5.9%8.2%
Interquartile 75% (IQ3)11.3%12.1%
Interquartile Range (IQR)5.5%3.9%
Standard Deviation (Sample)10.4%3.4%
Standard Deviation (Population)10.3%3.4%

Similar Demographics by Family Poverty

Demographics Similar to Australians by Family Poverty

In terms of family poverty, the demographic groups most similar to Australians are Immigrants from Belgium (7.8%, a difference of 0.010%), Northern European (7.8%, a difference of 0.030%), Dutch (7.8%, a difference of 0.040%), Immigrants from Canada (7.8%, a difference of 0.060%), and Cambodian (7.8%, a difference of 0.070%).
DemographicsRating | RankFamily Poverty
Immigrants | Netherlands
98.6
/100
|
#61
Exceptional
7.7%
Macedonians
98.6
/100
|
#62
Exceptional
7.8%
Zimbabweans
98.4
/100
|
#63
Exceptional
7.8%
Koreans
98.3
/100
|
#64
Exceptional
7.8%
Immigrants | Bulgaria
98.3
/100
|
#65
Exceptional
7.8%
Dutch
98.3
/100
|
#66
Exceptional
7.8%
Northern Europeans
98.3
/100
|
#67
Exceptional
7.8%
Australians
98.2
/100
|
#68
Exceptional
7.8%
Immigrants | Belgium
98.2
/100
|
#69
Exceptional
7.8%
Immigrants | Canada
98.2
/100
|
#70
Exceptional
7.8%
Cambodians
98.2
/100
|
#71
Exceptional
7.8%
Immigrants | Romania
98.2
/100
|
#72
Exceptional
7.8%
Austrians
98.2
/100
|
#73
Exceptional
7.8%
Immigrants | China
98.1
/100
|
#74
Exceptional
7.8%
Immigrants | Croatia
98.1
/100
|
#75
Exceptional
7.8%

Demographics Similar to Immigrants from Zaire by Family Poverty

In terms of family poverty, the demographic groups most similar to Immigrants from Zaire are Immigrants from Western Africa (10.7%, a difference of 0.11%), Iroquois (10.7%, a difference of 0.12%), Salvadoran (10.7%, a difference of 0.40%), Ecuadorian (10.8%, a difference of 0.41%), and Immigrants from Liberia (10.8%, a difference of 0.78%).
DemographicsRating | RankFamily Poverty
Immigrants | Burma/Myanmar
0.6
/100
|
#245
Tragic
10.5%
Cherokee
0.5
/100
|
#246
Tragic
10.6%
Liberians
0.4
/100
|
#247
Tragic
10.6%
Nicaraguans
0.4
/100
|
#248
Tragic
10.6%
Cubans
0.4
/100
|
#249
Tragic
10.6%
Salvadorans
0.3
/100
|
#250
Tragic
10.7%
Iroquois
0.3
/100
|
#251
Tragic
10.7%
Immigrants | Zaire
0.3
/100
|
#252
Tragic
10.7%
Immigrants | Western Africa
0.3
/100
|
#253
Tragic
10.7%
Ecuadorians
0.2
/100
|
#254
Tragic
10.8%
Immigrants | Liberia
0.2
/100
|
#255
Tragic
10.8%
Chickasaw
0.2
/100
|
#256
Tragic
10.8%
Immigrants | Ghana
0.2
/100
|
#257
Tragic
10.8%
Sub-Saharan Africans
0.2
/100
|
#258
Tragic
10.9%
Mexican American Indians
0.2
/100
|
#259
Tragic
10.9%