Paraguayan vs Immigrants from Zaire Family Poverty
COMPARE
Paraguayan
Immigrants from Zaire
Family Poverty
Family Poverty Comparison
Paraguayans
Immigrants from Zaire
8.3%
FAMILY POVERTY
91.2/ 100
METRIC RATING
122nd/ 347
METRIC RANK
10.7%
FAMILY POVERTY
0.3/ 100
METRIC RATING
252nd/ 347
METRIC RANK
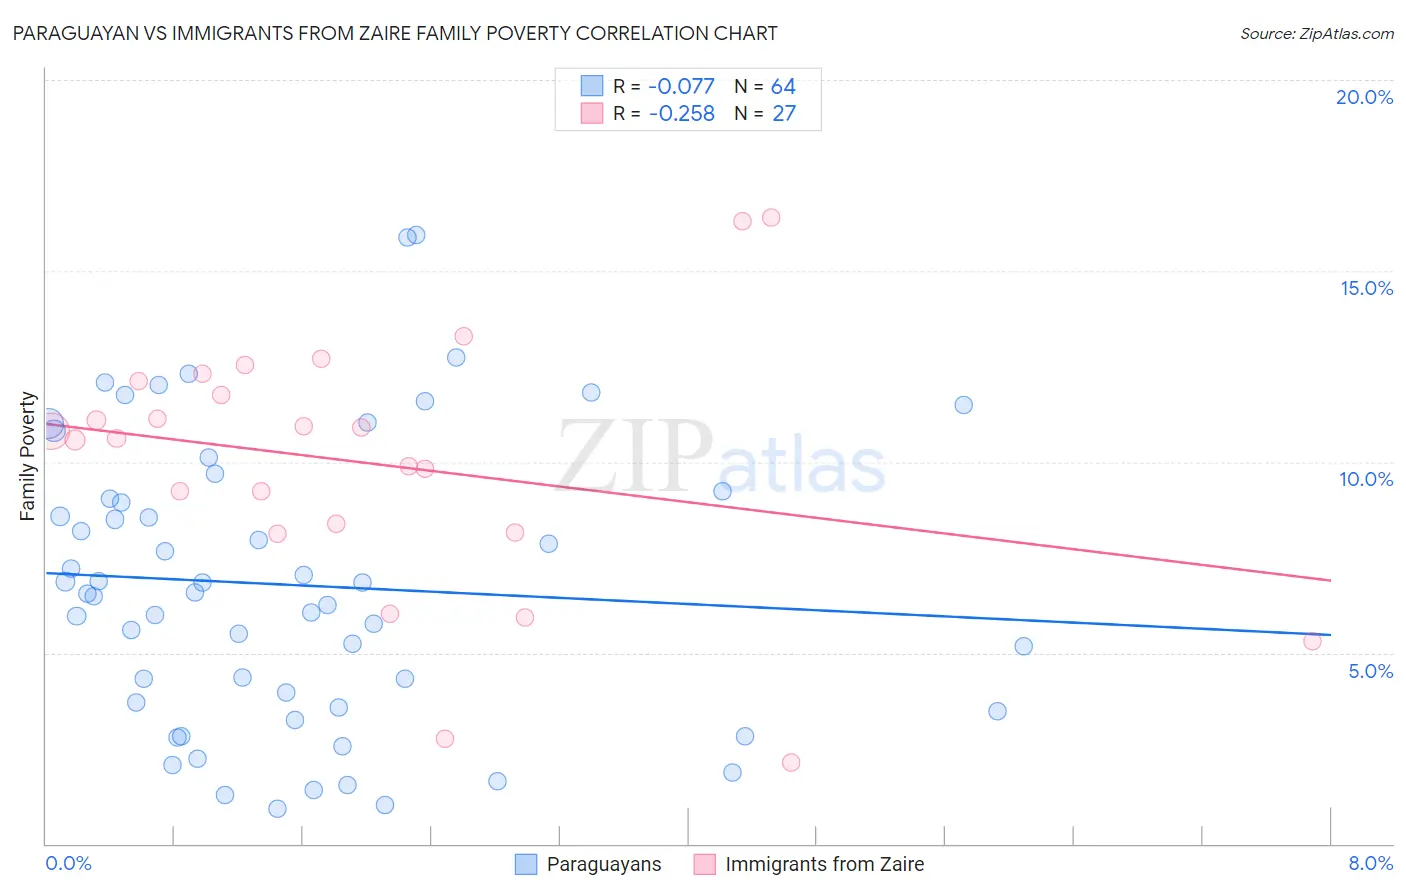
Paraguayan vs Immigrants from Zaire Family Poverty Correlation Chart
The statistical analysis conducted on geographies consisting of 95,035,993 people shows a slight negative correlation between the proportion of Paraguayans and poverty level among families in the United States with a correlation coefficient (R) of -0.077 and weighted average of 8.3%. Similarly, the statistical analysis conducted on geographies consisting of 107,226,893 people shows a weak negative correlation between the proportion of Immigrants from Zaire and poverty level among families in the United States with a correlation coefficient (R) of -0.258 and weighted average of 10.7%, a difference of 29.1%.
Family Poverty Correlation Summary
| Measurement | Paraguayan | Immigrants from Zaire |
| Minimum | 0.93% | 2.1% |
| Maximum | 16.0% | 16.4% |
| Range | 15.0% | 14.3% |
| Mean | 6.8% | 9.9% |
| Median | 6.6% | 10.6% |
| Interquartile 25% (IQ1) | 3.6% | 8.2% |
| Interquartile 75% (IQ3) | 9.1% | 12.1% |
| Interquartile Range (IQR) | 5.5% | 3.9% |
| Standard Deviation (Sample) | 3.7% | 3.4% |
| Standard Deviation (Population) | 3.7% | 3.4% |
Similar Demographics by Family Poverty
Demographics Similar to Paraguayans by Family Poverty
In terms of family poverty, the demographic groups most similar to Paraguayans are Native Hawaiian (8.3%, a difference of 0.010%), Palestinian (8.3%, a difference of 0.070%), Soviet Union (8.3%, a difference of 0.17%), Immigrants from Egypt (8.3%, a difference of 0.18%), and Pakistani (8.3%, a difference of 0.21%).
| Demographics | Rating | Rank | Family Poverty |
| Immigrants | Israel | 93.5 /100 | #115 | Exceptional 8.2% |
| South Africans | 93.4 /100 | #116 | Exceptional 8.2% |
| Immigrants | Russia | 93.2 /100 | #117 | Exceptional 8.2% |
| Immigrants | Western Europe | 92.9 /100 | #118 | Exceptional 8.2% |
| French | 92.8 /100 | #119 | Exceptional 8.3% |
| Immigrants | Egypt | 91.6 /100 | #120 | Exceptional 8.3% |
| Native Hawaiians | 91.3 /100 | #121 | Exceptional 8.3% |
| Paraguayans | 91.2 /100 | #122 | Exceptional 8.3% |
| Palestinians | 91.1 /100 | #123 | Exceptional 8.3% |
| Soviet Union | 90.8 /100 | #124 | Exceptional 8.3% |
| Pakistanis | 90.8 /100 | #125 | Exceptional 8.3% |
| Icelanders | 90.3 /100 | #126 | Exceptional 8.3% |
| Immigrants | Hungary | 89.9 /100 | #127 | Excellent 8.4% |
| Argentineans | 89.6 /100 | #128 | Excellent 8.4% |
| Portuguese | 89.2 /100 | #129 | Excellent 8.4% |
Demographics Similar to Immigrants from Zaire by Family Poverty
In terms of family poverty, the demographic groups most similar to Immigrants from Zaire are Immigrants from Western Africa (10.7%, a difference of 0.11%), Iroquois (10.7%, a difference of 0.12%), Salvadoran (10.7%, a difference of 0.40%), Ecuadorian (10.8%, a difference of 0.41%), and Immigrants from Liberia (10.8%, a difference of 0.78%).
| Demographics | Rating | Rank | Family Poverty |
| Immigrants | Burma/Myanmar | 0.6 /100 | #245 | Tragic 10.5% |
| Cherokee | 0.5 /100 | #246 | Tragic 10.6% |
| Liberians | 0.4 /100 | #247 | Tragic 10.6% |
| Nicaraguans | 0.4 /100 | #248 | Tragic 10.6% |
| Cubans | 0.4 /100 | #249 | Tragic 10.6% |
| Salvadorans | 0.3 /100 | #250 | Tragic 10.7% |
| Iroquois | 0.3 /100 | #251 | Tragic 10.7% |
| Immigrants | Zaire | 0.3 /100 | #252 | Tragic 10.7% |
| Immigrants | Western Africa | 0.3 /100 | #253 | Tragic 10.7% |
| Ecuadorians | 0.2 /100 | #254 | Tragic 10.8% |
| Immigrants | Liberia | 0.2 /100 | #255 | Tragic 10.8% |
| Chickasaw | 0.2 /100 | #256 | Tragic 10.8% |
| Immigrants | Ghana | 0.2 /100 | #257 | Tragic 10.8% |
| Sub-Saharan Africans | 0.2 /100 | #258 | Tragic 10.9% |
| Mexican American Indians | 0.2 /100 | #259 | Tragic 10.9% |