Welsh vs Immigrants from Zaire Single Male Poverty
COMPARE
Welsh
Immigrants from Zaire
Single Male Poverty
Single Male Poverty Comparison
Welsh
Immigrants from Zaire
14.0%
SINGLE MALE POVERTY
0.1/ 100
METRIC RATING
273rd/ 347
METRIC RANK
13.6%
SINGLE MALE POVERTY
0.9/ 100
METRIC RATING
251st/ 347
METRIC RANK
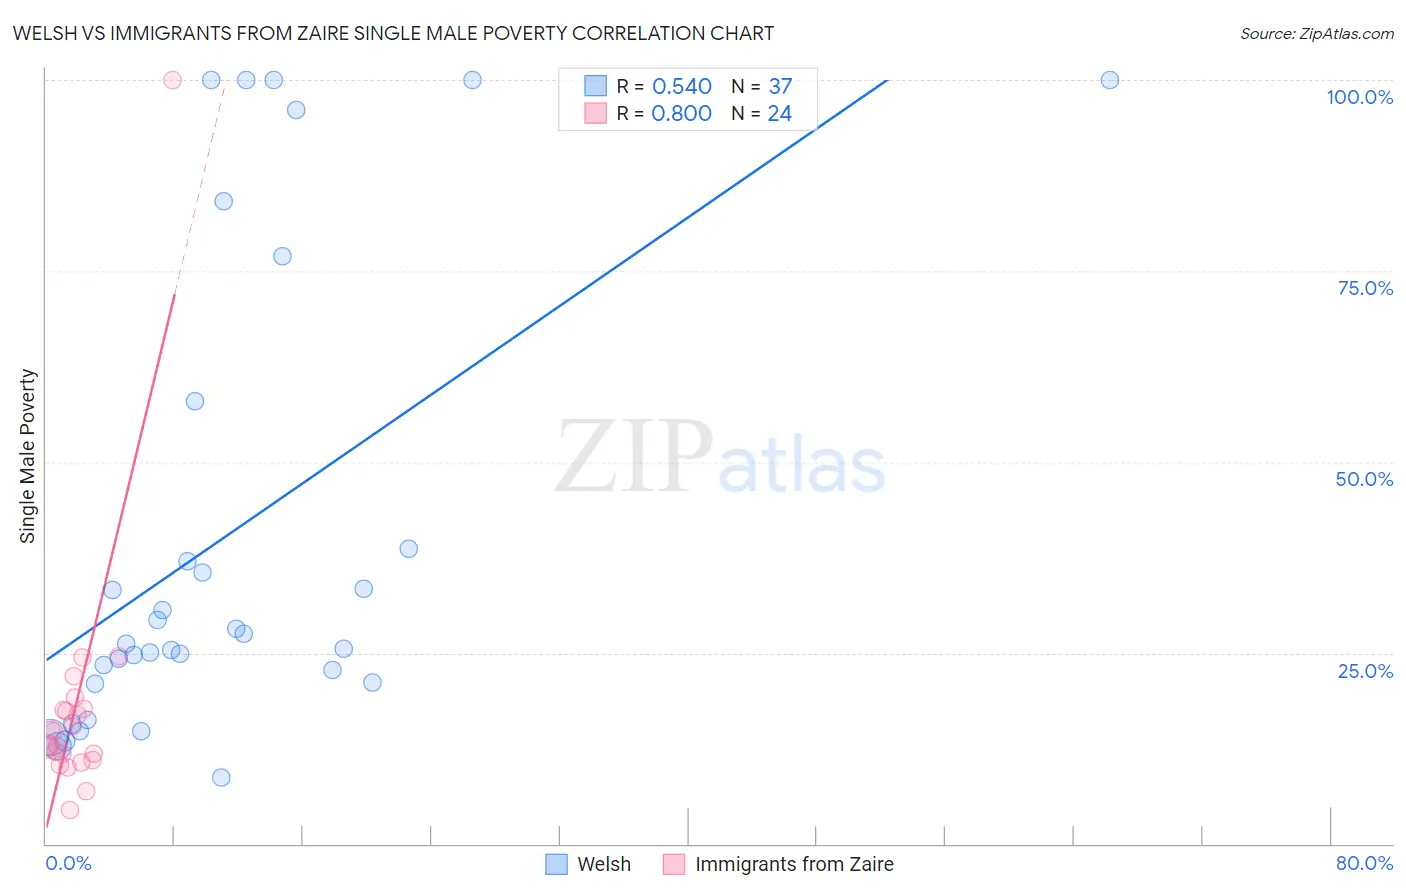
Welsh vs Immigrants from Zaire Single Male Poverty Correlation Chart
The statistical analysis conducted on geographies consisting of 442,898,896 people shows a substantial positive correlation between the proportion of Welsh and poverty level among single males in the United States with a correlation coefficient (R) of 0.540 and weighted average of 14.0%. Similarly, the statistical analysis conducted on geographies consisting of 103,503,403 people shows a strong positive correlation between the proportion of Immigrants from Zaire and poverty level among single males in the United States with a correlation coefficient (R) of 0.800 and weighted average of 13.6%, a difference of 3.2%.
Single Male Poverty Correlation Summary
| Measurement | Welsh | Immigrants from Zaire |
| Minimum | 8.7% | 4.4% |
| Maximum | 100.0% | 100.0% |
| Range | 91.3% | 95.6% |
| Mean | 40.1% | 18.0% |
| Median | 26.2% | 13.8% |
| Interquartile 25% (IQ1) | 21.0% | 11.3% |
| Interquartile 75% (IQ3) | 48.3% | 17.6% |
| Interquartile Range (IQR) | 27.3% | 6.2% |
| Standard Deviation (Sample) | 30.6% | 18.2% |
| Standard Deviation (Population) | 30.2% | 17.8% |
Similar Demographics by Single Male Poverty
Demographics Similar to Welsh by Single Male Poverty
In terms of single male poverty, the demographic groups most similar to Welsh are Honduran (14.0%, a difference of 0.13%), English (14.1%, a difference of 0.21%), Dutch (14.1%, a difference of 0.32%), Mexican (14.0%, a difference of 0.35%), and Immigrants from Honduras (14.1%, a difference of 0.36%).
| Demographics | Rating | Rank | Single Male Poverty |
| Immigrants | Cabo Verde | 0.1 /100 | #266 | Tragic 13.9% |
| Germans | 0.1 /100 | #267 | Tragic 13.9% |
| Immigrants | Mexico | 0.1 /100 | #268 | Tragic 13.9% |
| Scottish | 0.1 /100 | #269 | Tragic 14.0% |
| Immigrants | Saudi Arabia | 0.1 /100 | #270 | Tragic 14.0% |
| Irish | 0.1 /100 | #271 | Tragic 14.0% |
| Mexicans | 0.1 /100 | #272 | Tragic 14.0% |
| Welsh | 0.1 /100 | #273 | Tragic 14.0% |
| Hondurans | 0.1 /100 | #274 | Tragic 14.0% |
| English | 0.1 /100 | #275 | Tragic 14.1% |
| Dutch | 0.1 /100 | #276 | Tragic 14.1% |
| Immigrants | Honduras | 0.0 /100 | #277 | Tragic 14.1% |
| Slovaks | 0.0 /100 | #278 | Tragic 14.1% |
| Indonesians | 0.0 /100 | #279 | Tragic 14.1% |
| Hmong | 0.0 /100 | #280 | Tragic 14.2% |
Demographics Similar to Immigrants from Zaire by Single Male Poverty
In terms of single male poverty, the demographic groups most similar to Immigrants from Zaire are Finnish (13.6%, a difference of 0.050%), Immigrants from Somalia (13.6%, a difference of 0.11%), Spanish (13.6%, a difference of 0.13%), German Russian (13.6%, a difference of 0.19%), and Czech (13.5%, a difference of 0.37%).
| Demographics | Rating | Rank | Single Male Poverty |
| Immigrants | Senegal | 1.7 /100 | #244 | Tragic 13.5% |
| Immigrants | Latin America | 1.3 /100 | #245 | Tragic 13.5% |
| Immigrants | Micronesia | 1.2 /100 | #246 | Tragic 13.5% |
| Belgians | 1.2 /100 | #247 | Tragic 13.5% |
| Czechs | 1.2 /100 | #248 | Tragic 13.5% |
| Spanish | 1.0 /100 | #249 | Tragic 13.6% |
| Immigrants | Somalia | 1.0 /100 | #250 | Tragic 13.6% |
| Immigrants | Zaire | 0.9 /100 | #251 | Tragic 13.6% |
| Finns | 0.9 /100 | #252 | Tragic 13.6% |
| German Russians | 0.8 /100 | #253 | Tragic 13.6% |
| Sub-Saharan Africans | 0.5 /100 | #254 | Tragic 13.7% |
| Spaniards | 0.4 /100 | #255 | Tragic 13.7% |
| Immigrants | Belize | 0.4 /100 | #256 | Tragic 13.7% |
| Immigrants | Central America | 0.3 /100 | #257 | Tragic 13.8% |
| Immigrants | Guatemala | 0.3 /100 | #258 | Tragic 13.8% |