Kenyan vs Immigrants from Zaire Family Poverty
COMPARE
Kenyan
Immigrants from Zaire
Family Poverty
Family Poverty Comparison
Kenyans
Immigrants from Zaire
8.9%
FAMILY POVERTY
58.2/ 100
METRIC RATING
170th/ 347
METRIC RANK
10.7%
FAMILY POVERTY
0.3/ 100
METRIC RATING
252nd/ 347
METRIC RANK
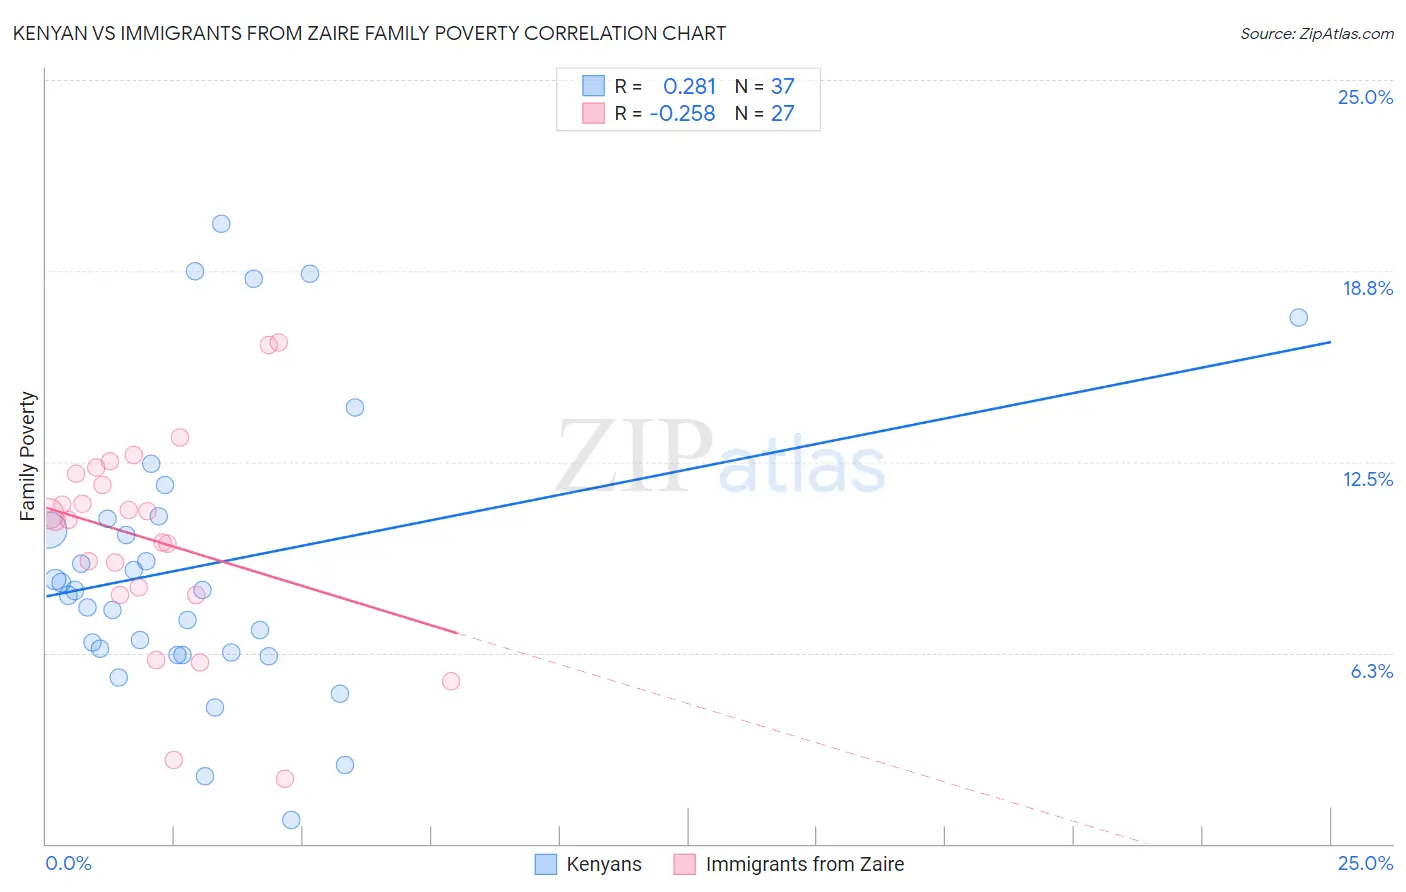
Kenyan vs Immigrants from Zaire Family Poverty Correlation Chart
The statistical analysis conducted on geographies consisting of 168,038,695 people shows a weak positive correlation between the proportion of Kenyans and poverty level among families in the United States with a correlation coefficient (R) of 0.281 and weighted average of 8.9%. Similarly, the statistical analysis conducted on geographies consisting of 107,226,893 people shows a weak negative correlation between the proportion of Immigrants from Zaire and poverty level among families in the United States with a correlation coefficient (R) of -0.258 and weighted average of 10.7%, a difference of 20.5%.
Family Poverty Correlation Summary
| Measurement | Kenyan | Immigrants from Zaire |
| Minimum | 0.77% | 2.1% |
| Maximum | 20.3% | 16.4% |
| Range | 19.5% | 14.3% |
| Mean | 9.1% | 9.9% |
| Median | 8.3% | 10.6% |
| Interquartile 25% (IQ1) | 6.2% | 8.2% |
| Interquartile 75% (IQ3) | 10.7% | 12.1% |
| Interquartile Range (IQR) | 4.5% | 3.9% |
| Standard Deviation (Sample) | 4.7% | 3.4% |
| Standard Deviation (Population) | 4.6% | 3.4% |
Similar Demographics by Family Poverty
Demographics Similar to Kenyans by Family Poverty
In terms of family poverty, the demographic groups most similar to Kenyans are Lebanese (8.9%, a difference of 0.080%), Immigrants from Peru (8.9%, a difference of 0.090%), Immigrants from Chile (8.9%, a difference of 0.19%), Immigrants from Fiji (8.9%, a difference of 0.25%), and Israeli (8.9%, a difference of 0.54%).
| Demographics | Rating | Rank | Family Poverty |
| Pennsylvania Germans | 66.0 /100 | #163 | Good 8.8% |
| Celtics | 64.9 /100 | #164 | Good 8.8% |
| Guamanians/Chamorros | 64.7 /100 | #165 | Good 8.8% |
| Afghans | 63.5 /100 | #166 | Good 8.8% |
| Immigrants | Ethiopia | 62.5 /100 | #167 | Good 8.9% |
| Israelis | 62.1 /100 | #168 | Good 8.9% |
| Immigrants | Chile | 59.6 /100 | #169 | Average 8.9% |
| Kenyans | 58.2 /100 | #170 | Average 8.9% |
| Lebanese | 57.6 /100 | #171 | Average 8.9% |
| Immigrants | Peru | 57.5 /100 | #172 | Average 8.9% |
| Immigrants | Fiji | 56.4 /100 | #173 | Average 8.9% |
| Immigrants | Albania | 50.0 /100 | #174 | Average 9.0% |
| Costa Ricans | 49.3 /100 | #175 | Average 9.0% |
| Immigrants | Syria | 47.5 /100 | #176 | Average 9.0% |
| Hawaiians | 47.2 /100 | #177 | Average 9.0% |
Demographics Similar to Immigrants from Zaire by Family Poverty
In terms of family poverty, the demographic groups most similar to Immigrants from Zaire are Immigrants from Western Africa (10.7%, a difference of 0.11%), Iroquois (10.7%, a difference of 0.12%), Salvadoran (10.7%, a difference of 0.40%), Ecuadorian (10.8%, a difference of 0.41%), and Immigrants from Liberia (10.8%, a difference of 0.78%).
| Demographics | Rating | Rank | Family Poverty |
| Immigrants | Burma/Myanmar | 0.6 /100 | #245 | Tragic 10.5% |
| Cherokee | 0.5 /100 | #246 | Tragic 10.6% |
| Liberians | 0.4 /100 | #247 | Tragic 10.6% |
| Nicaraguans | 0.4 /100 | #248 | Tragic 10.6% |
| Cubans | 0.4 /100 | #249 | Tragic 10.6% |
| Salvadorans | 0.3 /100 | #250 | Tragic 10.7% |
| Iroquois | 0.3 /100 | #251 | Tragic 10.7% |
| Immigrants | Zaire | 0.3 /100 | #252 | Tragic 10.7% |
| Immigrants | Western Africa | 0.3 /100 | #253 | Tragic 10.7% |
| Ecuadorians | 0.2 /100 | #254 | Tragic 10.8% |
| Immigrants | Liberia | 0.2 /100 | #255 | Tragic 10.8% |
| Chickasaw | 0.2 /100 | #256 | Tragic 10.8% |
| Immigrants | Ghana | 0.2 /100 | #257 | Tragic 10.8% |
| Sub-Saharan Africans | 0.2 /100 | #258 | Tragic 10.9% |
| Mexican American Indians | 0.2 /100 | #259 | Tragic 10.9% |