Welsh vs Immigrants from Zaire Professional Degree
COMPARE
Welsh
Immigrants from Zaire
Professional Degree
Professional Degree Comparison
Welsh
Immigrants from Zaire
4.3%
PROFESSIONAL DEGREE
35.8/ 100
METRIC RATING
185th/ 347
METRIC RANK
4.5%
PROFESSIONAL DEGREE
57.4/ 100
METRIC RATING
170th/ 347
METRIC RANK
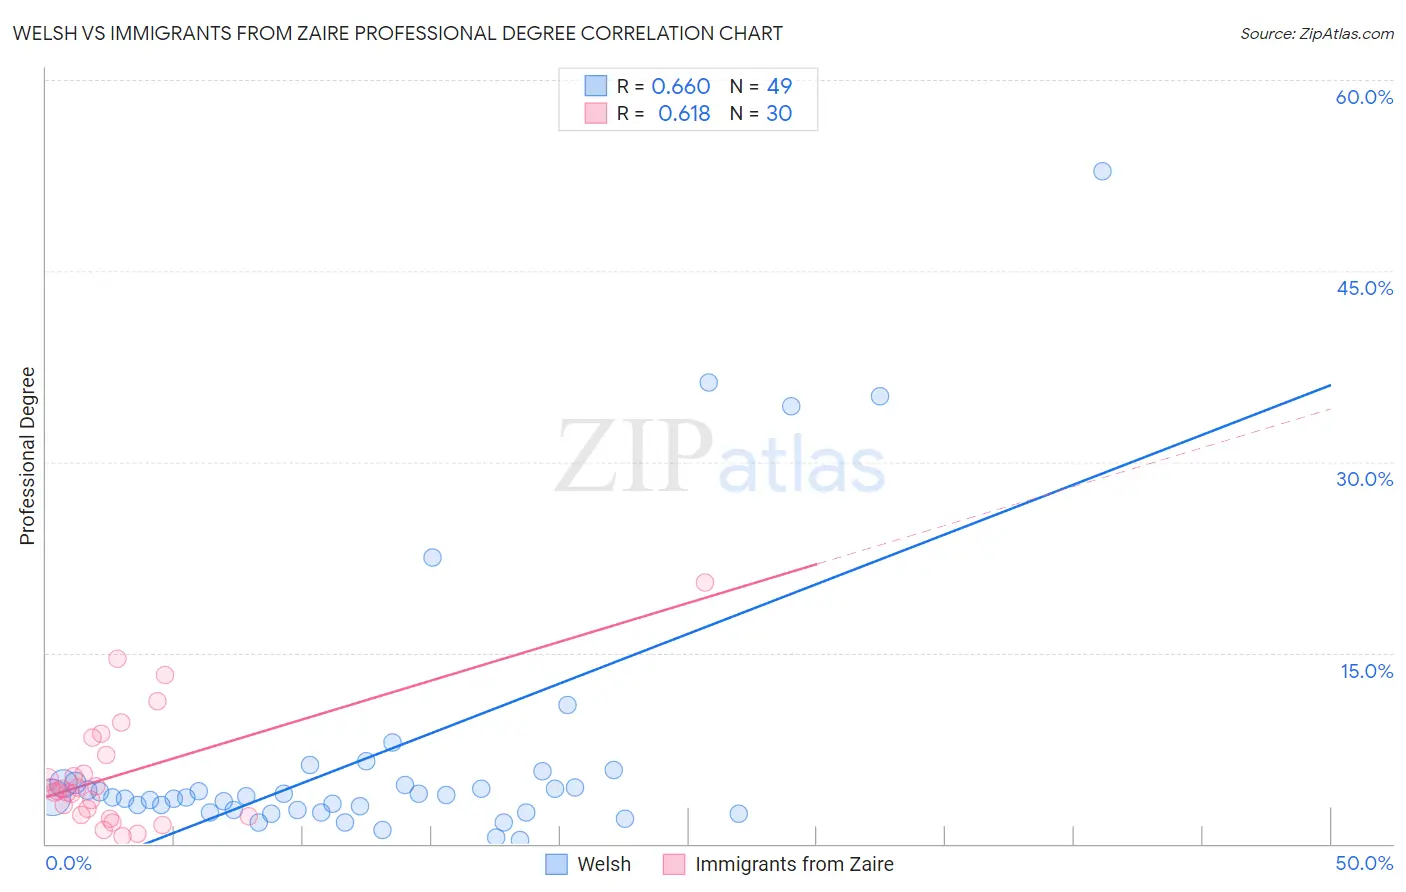
Welsh vs Immigrants from Zaire Professional Degree Correlation Chart
The statistical analysis conducted on geographies consisting of 523,806,417 people shows a significant positive correlation between the proportion of Welsh and percentage of population with at least professional degree education in the United States with a correlation coefficient (R) of 0.660 and weighted average of 4.3%. Similarly, the statistical analysis conducted on geographies consisting of 107,228,641 people shows a significant positive correlation between the proportion of Immigrants from Zaire and percentage of population with at least professional degree education in the United States with a correlation coefficient (R) of 0.618 and weighted average of 4.5%, a difference of 3.3%.
Professional Degree Correlation Summary
| Measurement | Welsh | Immigrants from Zaire |
| Minimum | 0.26% | 0.59% |
| Maximum | 52.8% | 20.5% |
| Range | 52.6% | 19.9% |
| Mean | 7.0% | 5.5% |
| Median | 3.6% | 4.2% |
| Interquartile 25% (IQ1) | 2.5% | 2.3% |
| Interquartile 75% (IQ3) | 4.8% | 7.0% |
| Interquartile Range (IQR) | 2.2% | 4.7% |
| Standard Deviation (Sample) | 10.6% | 4.5% |
| Standard Deviation (Population) | 10.5% | 4.5% |
Demographics Similar to Welsh and Immigrants from Zaire by Professional Degree
In terms of professional degree, the demographic groups most similar to Welsh are Belgian (4.3%, a difference of 0.060%), Scotch-Irish (4.3%, a difference of 0.27%), Immigrants from Cameroon (4.3%, a difference of 0.42%), Bermudan (4.4%, a difference of 1.1%), and Immigrants (4.4%, a difference of 1.1%). Similarly, the demographic groups most similar to Immigrants from Zaire are Chinese (4.5%, a difference of 0.18%), Immigrants from Sierra Leone (4.5%, a difference of 0.19%), Immigrants from Bangladesh (4.4%, a difference of 0.22%), Immigrants from Afghanistan (4.5%, a difference of 0.26%), and Spaniard (4.4%, a difference of 0.79%).
| Demographics | Rating | Rank | Professional Degree |
| Immigrants | Afghanistan | 59.2 /100 | #167 | Average 4.5% |
| Immigrants | Sierra Leone | 58.7 /100 | #168 | Average 4.5% |
| Chinese | 58.6 /100 | #169 | Average 4.5% |
| Immigrants | Zaire | 57.4 /100 | #170 | Average 4.5% |
| Immigrants | Bangladesh | 56.0 /100 | #171 | Average 4.4% |
| Spaniards | 52.0 /100 | #172 | Average 4.4% |
| English | 50.1 /100 | #173 | Average 4.4% |
| Kenyans | 50.0 /100 | #174 | Average 4.4% |
| Irish | 50.0 /100 | #175 | Average 4.4% |
| Immigrants | Peru | 49.3 /100 | #176 | Average 4.4% |
| Celtics | 47.6 /100 | #177 | Average 4.4% |
| Immigrants | Costa Rica | 46.7 /100 | #178 | Average 4.4% |
| Immigrants | Kenya | 45.9 /100 | #179 | Average 4.4% |
| Czechs | 44.9 /100 | #180 | Average 4.4% |
| Danes | 43.5 /100 | #181 | Average 4.4% |
| Immigrants | Immigrants | 43.2 /100 | #182 | Average 4.4% |
| Bermudans | 43.1 /100 | #183 | Average 4.4% |
| Belgians | 36.2 /100 | #184 | Fair 4.3% |
| Welsh | 35.8 /100 | #185 | Fair 4.3% |
| Scotch-Irish | 34.2 /100 | #186 | Fair 4.3% |
| Immigrants | Cameroon | 33.3 /100 | #187 | Fair 4.3% |