Welsh vs Native Hawaiian Family Poverty
COMPARE
Welsh
Native Hawaiian
Family Poverty
Family Poverty Comparison
Welsh
Native Hawaiians
8.1%
FAMILY POVERTY
95.8/ 100
METRIC RATING
99th/ 347
METRIC RANK
8.3%
FAMILY POVERTY
91.3/ 100
METRIC RATING
121st/ 347
METRIC RANK
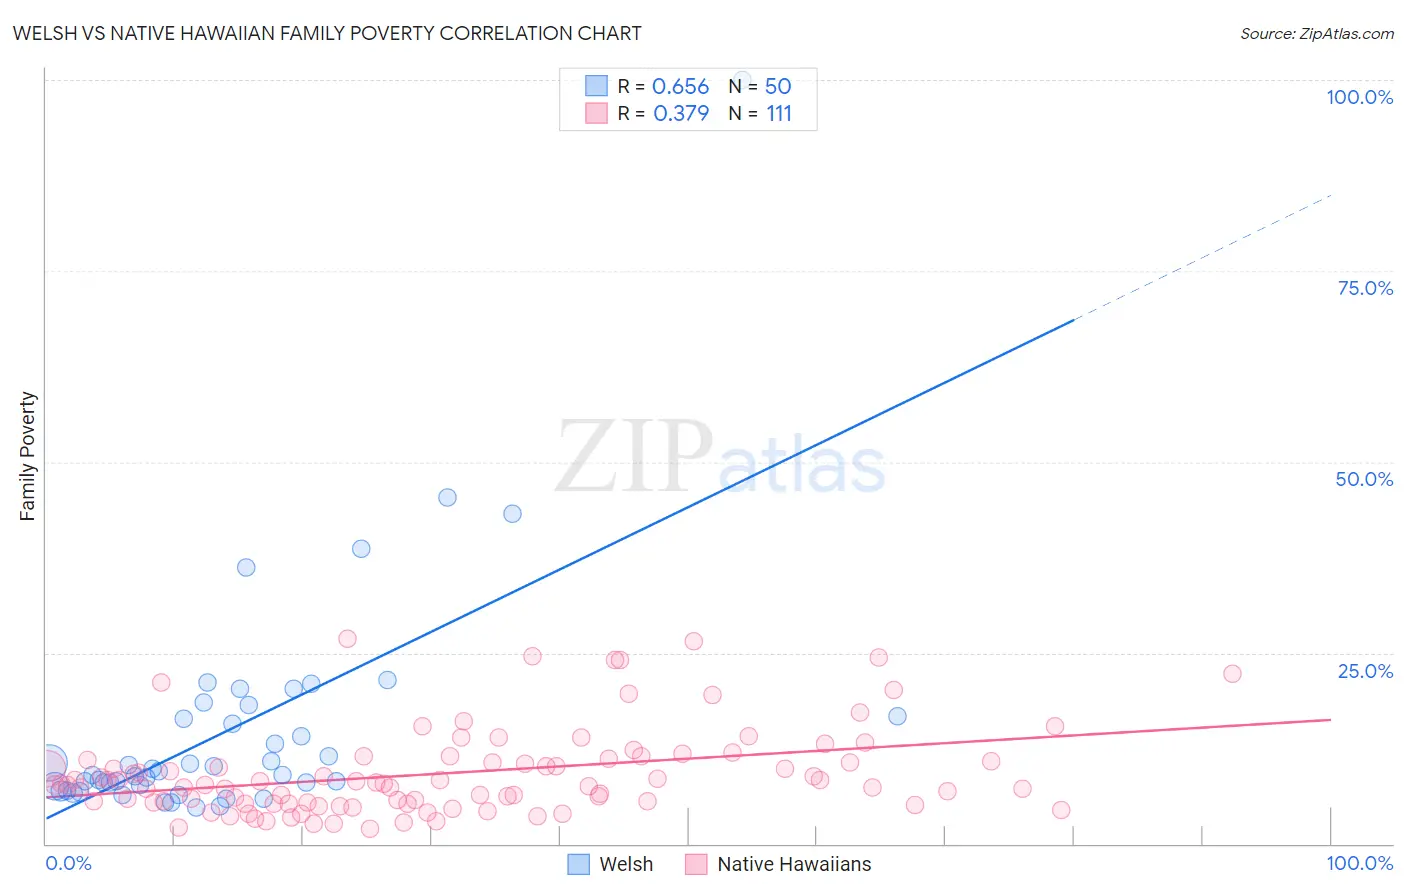
Welsh vs Native Hawaiian Family Poverty Correlation Chart
The statistical analysis conducted on geographies consisting of 525,428,616 people shows a significant positive correlation between the proportion of Welsh and poverty level among families in the United States with a correlation coefficient (R) of 0.656 and weighted average of 8.1%. Similarly, the statistical analysis conducted on geographies consisting of 331,480,181 people shows a mild positive correlation between the proportion of Native Hawaiians and poverty level among families in the United States with a correlation coefficient (R) of 0.379 and weighted average of 8.3%, a difference of 2.9%.
Family Poverty Correlation Summary
| Measurement | Welsh | Native Hawaiian |
| Minimum | 4.7% | 1.9% |
| Maximum | 100.0% | 26.8% |
| Range | 95.3% | 24.8% |
| Mean | 14.9% | 9.3% |
| Median | 9.2% | 7.9% |
| Interquartile 25% (IQ1) | 7.5% | 5.3% |
| Interquartile 75% (IQ3) | 16.7% | 11.1% |
| Interquartile Range (IQR) | 9.1% | 5.8% |
| Standard Deviation (Sample) | 15.6% | 5.7% |
| Standard Deviation (Population) | 15.4% | 5.6% |
Similar Demographics by Family Poverty
Demographics Similar to Welsh by Family Poverty
In terms of family poverty, the demographic groups most similar to Welsh are Immigrants from South Africa (8.1%, a difference of 0.070%), New Zealander (8.1%, a difference of 0.070%), Immigrants from Norway (8.1%, a difference of 0.10%), Immigrants from Indonesia (8.1%, a difference of 0.11%), and Immigrants from Eastern Europe (8.1%, a difference of 0.20%).
| Demographics | Rating | Rank | Family Poverty |
| Czechoslovakians | 96.8 /100 | #92 | Exceptional 8.0% |
| Tlingit-Haida | 96.7 /100 | #93 | Exceptional 8.0% |
| Immigrants | Pakistan | 96.6 /100 | #94 | Exceptional 8.0% |
| Immigrants | Philippines | 96.5 /100 | #95 | Exceptional 8.0% |
| Immigrants | Turkey | 96.5 /100 | #96 | Exceptional 8.0% |
| Immigrants | Switzerland | 96.1 /100 | #97 | Exceptional 8.1% |
| Immigrants | South Africa | 95.9 /100 | #98 | Exceptional 8.1% |
| Welsh | 95.8 /100 | #99 | Exceptional 8.1% |
| New Zealanders | 95.8 /100 | #100 | Exceptional 8.1% |
| Immigrants | Norway | 95.7 /100 | #101 | Exceptional 8.1% |
| Immigrants | Indonesia | 95.7 /100 | #102 | Exceptional 8.1% |
| Immigrants | Eastern Europe | 95.6 /100 | #103 | Exceptional 8.1% |
| Slavs | 95.6 /100 | #104 | Exceptional 8.1% |
| Laotians | 95.6 /100 | #105 | Exceptional 8.1% |
| Egyptians | 95.1 /100 | #106 | Exceptional 8.1% |
Demographics Similar to Native Hawaiians by Family Poverty
In terms of family poverty, the demographic groups most similar to Native Hawaiians are Paraguayan (8.3%, a difference of 0.010%), Palestinian (8.3%, a difference of 0.080%), Immigrants from Egypt (8.3%, a difference of 0.17%), Soviet Union (8.3%, a difference of 0.18%), and Pakistani (8.3%, a difference of 0.22%).
| Demographics | Rating | Rank | Family Poverty |
| Immigrants | Zimbabwe | 94.0 /100 | #114 | Exceptional 8.2% |
| Immigrants | Israel | 93.5 /100 | #115 | Exceptional 8.2% |
| South Africans | 93.4 /100 | #116 | Exceptional 8.2% |
| Immigrants | Russia | 93.2 /100 | #117 | Exceptional 8.2% |
| Immigrants | Western Europe | 92.9 /100 | #118 | Exceptional 8.2% |
| French | 92.8 /100 | #119 | Exceptional 8.3% |
| Immigrants | Egypt | 91.6 /100 | #120 | Exceptional 8.3% |
| Native Hawaiians | 91.3 /100 | #121 | Exceptional 8.3% |
| Paraguayans | 91.2 /100 | #122 | Exceptional 8.3% |
| Palestinians | 91.1 /100 | #123 | Exceptional 8.3% |
| Soviet Union | 90.8 /100 | #124 | Exceptional 8.3% |
| Pakistanis | 90.8 /100 | #125 | Exceptional 8.3% |
| Icelanders | 90.3 /100 | #126 | Exceptional 8.3% |
| Immigrants | Hungary | 89.9 /100 | #127 | Excellent 8.4% |
| Argentineans | 89.6 /100 | #128 | Excellent 8.4% |