Tsimshian vs Immigrants from Dominica Female Poverty
COMPARE
Tsimshian
Immigrants from Dominica
Female Poverty
Female Poverty Comparison
Tsimshian
Immigrants from Dominica
13.1%
FEMALE POVERTY
75.5/ 100
METRIC RATING
150th/ 347
METRIC RANK
17.5%
FEMALE POVERTY
0.0/ 100
METRIC RATING
320th/ 347
METRIC RANK
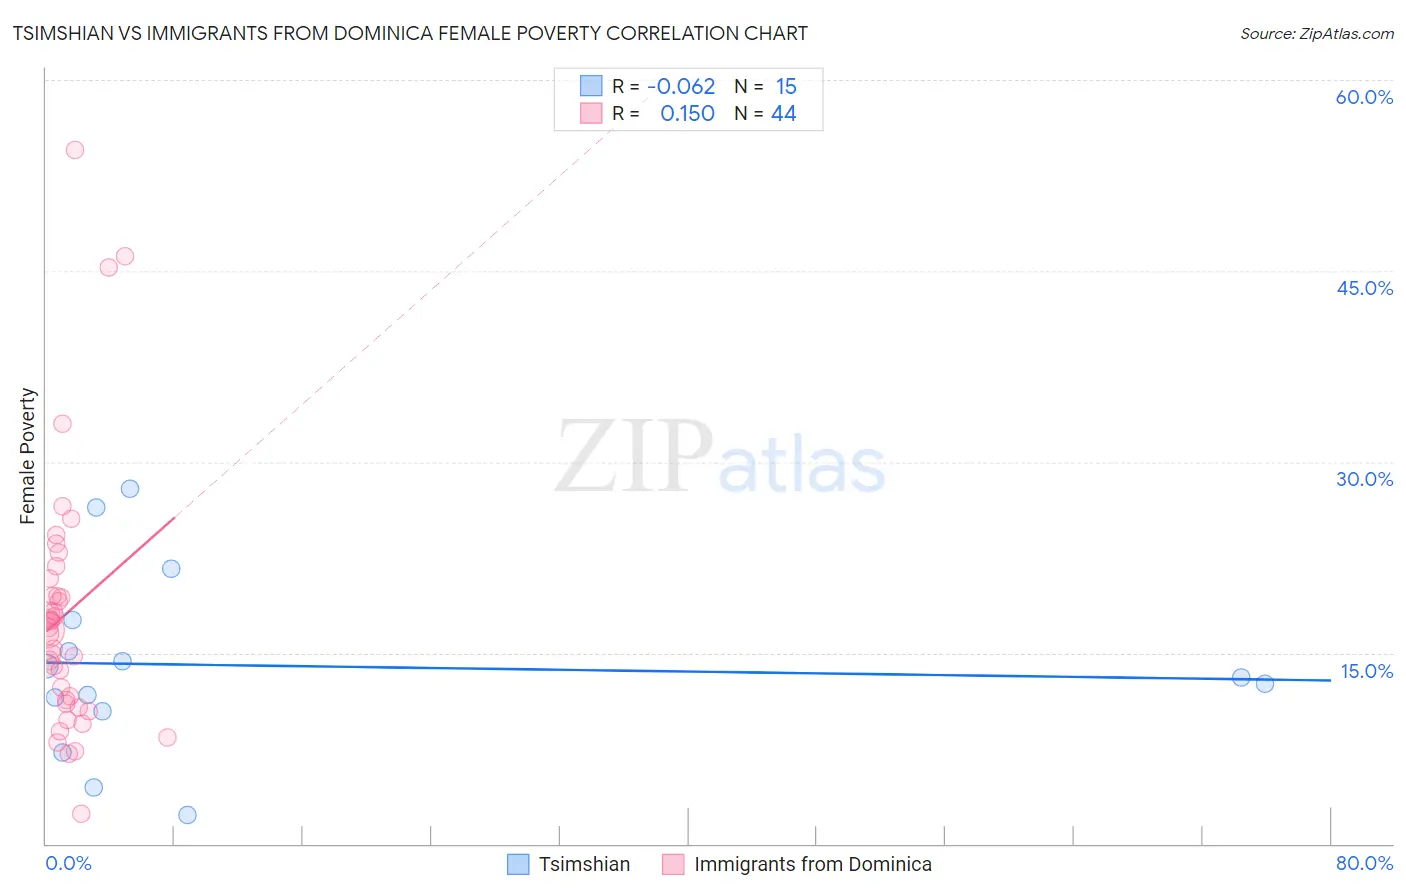
Tsimshian vs Immigrants from Dominica Female Poverty Correlation Chart
The statistical analysis conducted on geographies consisting of 15,626,462 people shows a slight negative correlation between the proportion of Tsimshian and poverty level among females in the United States with a correlation coefficient (R) of -0.062 and weighted average of 13.1%. Similarly, the statistical analysis conducted on geographies consisting of 83,788,429 people shows a poor positive correlation between the proportion of Immigrants from Dominica and poverty level among females in the United States with a correlation coefficient (R) of 0.150 and weighted average of 17.5%, a difference of 33.6%.
Female Poverty Correlation Summary
| Measurement | Tsimshian | Immigrants from Dominica |
| Minimum | 2.2% | 2.4% |
| Maximum | 27.8% | 54.5% |
| Range | 25.6% | 52.1% |
| Mean | 14.0% | 18.0% |
| Median | 13.1% | 16.9% |
| Interquartile 25% (IQ1) | 10.4% | 11.1% |
| Interquartile 75% (IQ3) | 17.6% | 20.1% |
| Interquartile Range (IQR) | 7.2% | 9.0% |
| Standard Deviation (Sample) | 7.2% | 10.3% |
| Standard Deviation (Population) | 6.9% | 10.2% |
Similar Demographics by Female Poverty
Demographics Similar to Tsimshian by Female Poverty
In terms of female poverty, the demographic groups most similar to Tsimshian are Taiwanese (13.1%, a difference of 0.030%), Immigrants from Germany (13.1%, a difference of 0.070%), Yugoslavian (13.1%, a difference of 0.19%), Samoan (13.1%, a difference of 0.24%), and Immigrants from Kazakhstan (13.0%, a difference of 0.44%).
| Demographics | Rating | Rank | Female Poverty |
| Immigrants | Malaysia | 80.4 /100 | #143 | Excellent 13.0% |
| Afghans | 79.8 /100 | #144 | Good 13.0% |
| Syrians | 79.6 /100 | #145 | Good 13.0% |
| Immigrants | Peru | 79.1 /100 | #146 | Good 13.0% |
| Immigrants | Kazakhstan | 78.6 /100 | #147 | Good 13.0% |
| Yugoslavians | 76.9 /100 | #148 | Good 13.1% |
| Taiwanese | 75.7 /100 | #149 | Good 13.1% |
| Tsimshian | 75.5 /100 | #150 | Good 13.1% |
| Immigrants | Germany | 74.9 /100 | #151 | Good 13.1% |
| Samoans | 73.6 /100 | #152 | Good 13.1% |
| Immigrants | Fiji | 71.0 /100 | #153 | Good 13.2% |
| Armenians | 70.4 /100 | #154 | Good 13.2% |
| Hungarians | 70.1 /100 | #155 | Good 13.2% |
| Immigrants | Bosnia and Herzegovina | 69.7 /100 | #156 | Good 13.2% |
| Immigrants | Northern Africa | 68.8 /100 | #157 | Good 13.2% |
Demographics Similar to Immigrants from Dominica by Female Poverty
In terms of female poverty, the demographic groups most similar to Immigrants from Dominica are Arapaho (17.5%, a difference of 0.060%), Cajun (17.5%, a difference of 0.080%), Ute (17.5%, a difference of 0.10%), Immigrants from Congo (17.4%, a difference of 0.42%), and Honduran (17.4%, a difference of 0.61%).
| Demographics | Rating | Rank | Female Poverty |
| British West Indians | 0.0 /100 | #313 | Tragic 17.0% |
| Dutch West Indians | 0.0 /100 | #314 | Tragic 17.1% |
| U.S. Virgin Islanders | 0.0 /100 | #315 | Tragic 17.3% |
| Hondurans | 0.0 /100 | #316 | Tragic 17.4% |
| Immigrants | Congo | 0.0 /100 | #317 | Tragic 17.4% |
| Ute | 0.0 /100 | #318 | Tragic 17.5% |
| Cajuns | 0.0 /100 | #319 | Tragic 17.5% |
| Immigrants | Dominica | 0.0 /100 | #320 | Tragic 17.5% |
| Arapaho | 0.0 /100 | #321 | Tragic 17.5% |
| Menominee | 0.0 /100 | #322 | Tragic 17.6% |
| Paiute | 0.0 /100 | #323 | Tragic 17.7% |
| Immigrants | Honduras | 0.0 /100 | #324 | Tragic 17.7% |
| Colville | 0.0 /100 | #325 | Tragic 17.8% |
| Central American Indians | 0.0 /100 | #326 | Tragic 18.0% |
| Yakama | 0.0 /100 | #327 | Tragic 18.0% |